¶ 6.5 GFM web portal
Users can access this application through EFAS, GloFAS or directly via the dedicated url https://portal.gfm.eodc.eu/
With this single-page application the following tasks can be performed, as described below:
|
|
|
|
|
|
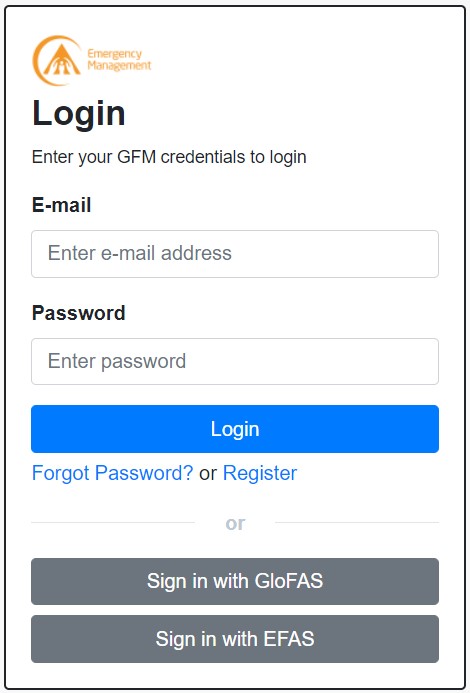
Registered users of GloFAS or EFAS can access the system by entering their account details, as shown below. Other users are required to select “Register” and fill in the registration form.
¶ 6.5.1 Definition of areas of interest (AOIs)
The AOI dashboard enables users to create and manage their AOIs. To create an AOI, first select “AOI” in the main banner (top graphic below) and then insert a “Name” and “Description” for the AOI and click “Next Step” (bottom graphic below).
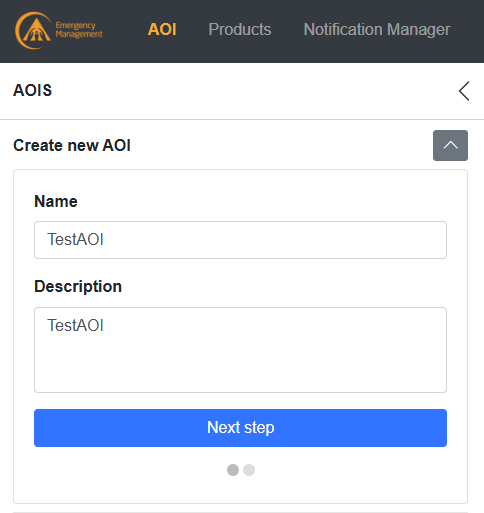
An AOI can be defined in three optional ways, which are explained below:
| 1 | Entering AOI’s upper-left and lower-right latitude and longitude coordinates. |
| 2 | Drawing AOI on a map. |
| 3 | Selecting a specific administrative region as an AOI. |
Note that the maximum number of AOIs for each user is limited to 25. Once the limit is reached, a new AOI can be added only if a previous AOI is deleted.
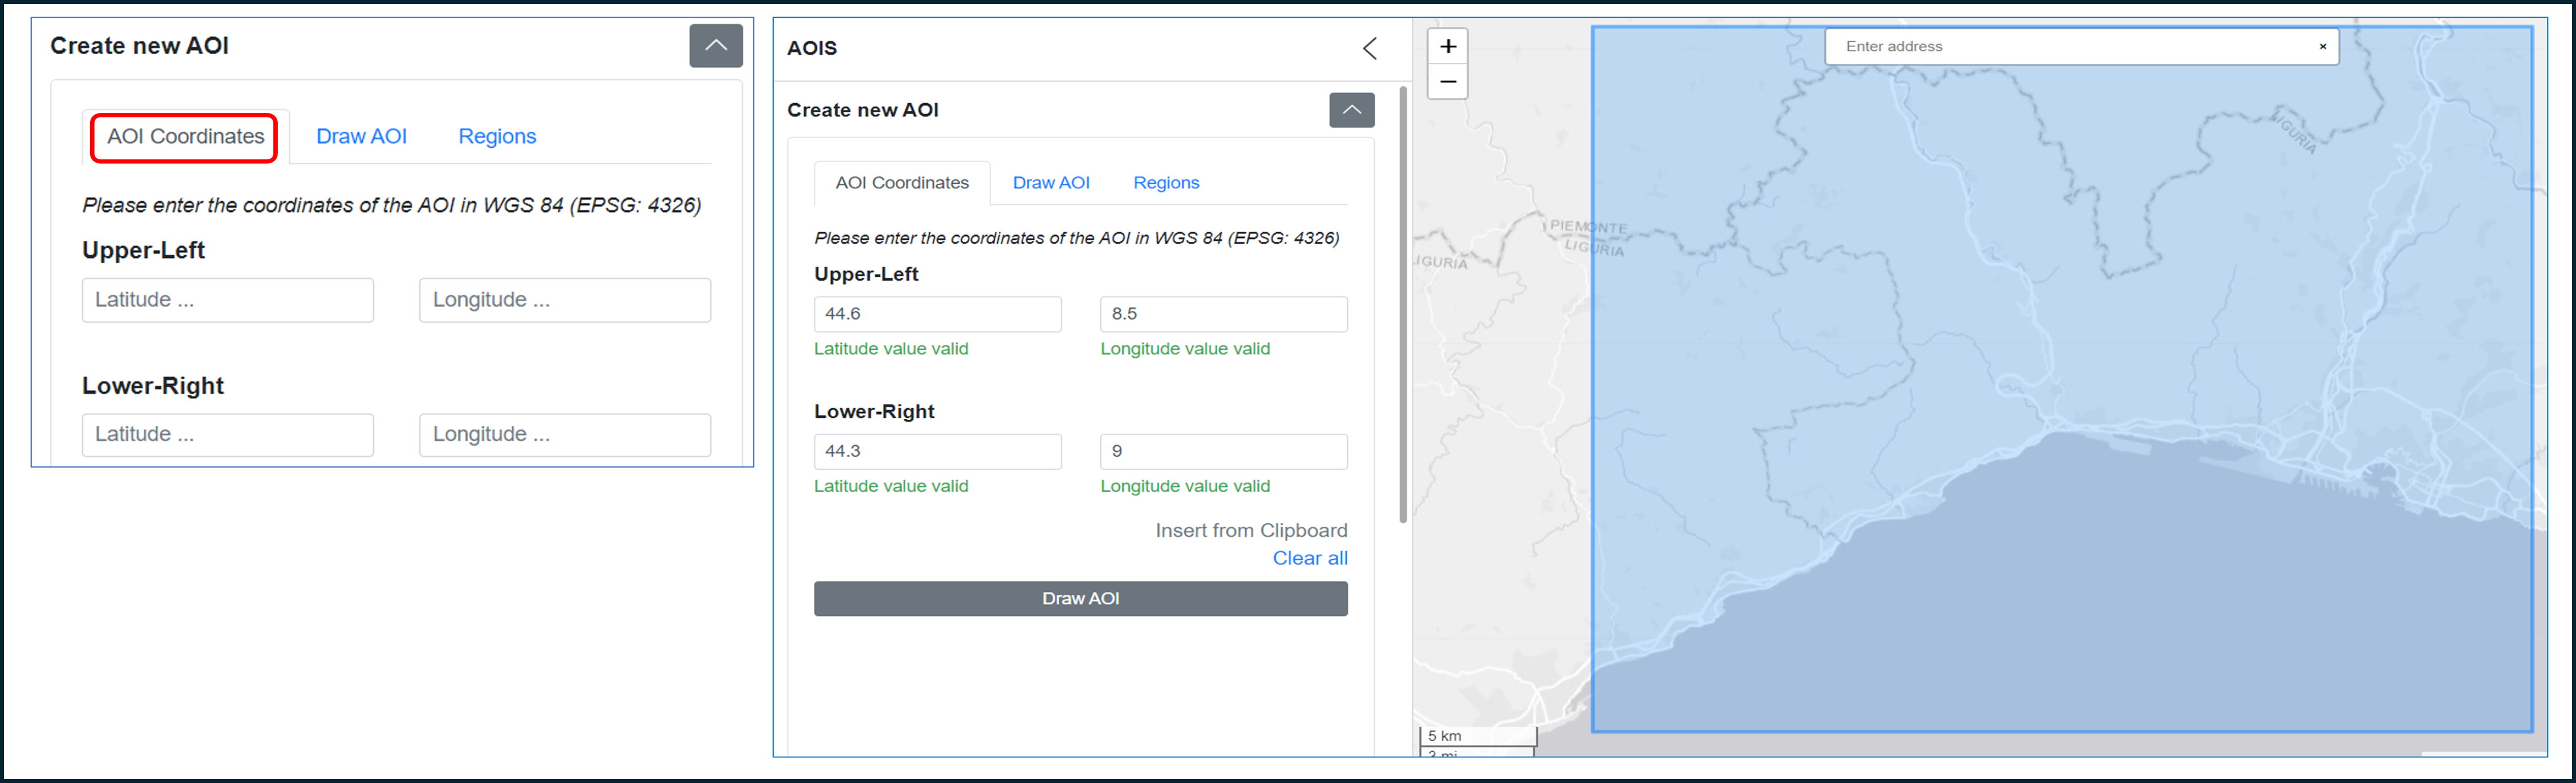
¶ Option 1 - Entering AOI’s upper-left and lower-right latitude and longitude coordinates:
Select the "AOI Coordinates" button, enter the upper-left and lower-right latitude and longitude coordinates of the AOI, and click another button, for example “Draw AOI” (left graphic below). The system will display the selection on the map (right graphic below). Save the AOI (using the “Save AOI” button) to add the AOI to the list of AOIs.
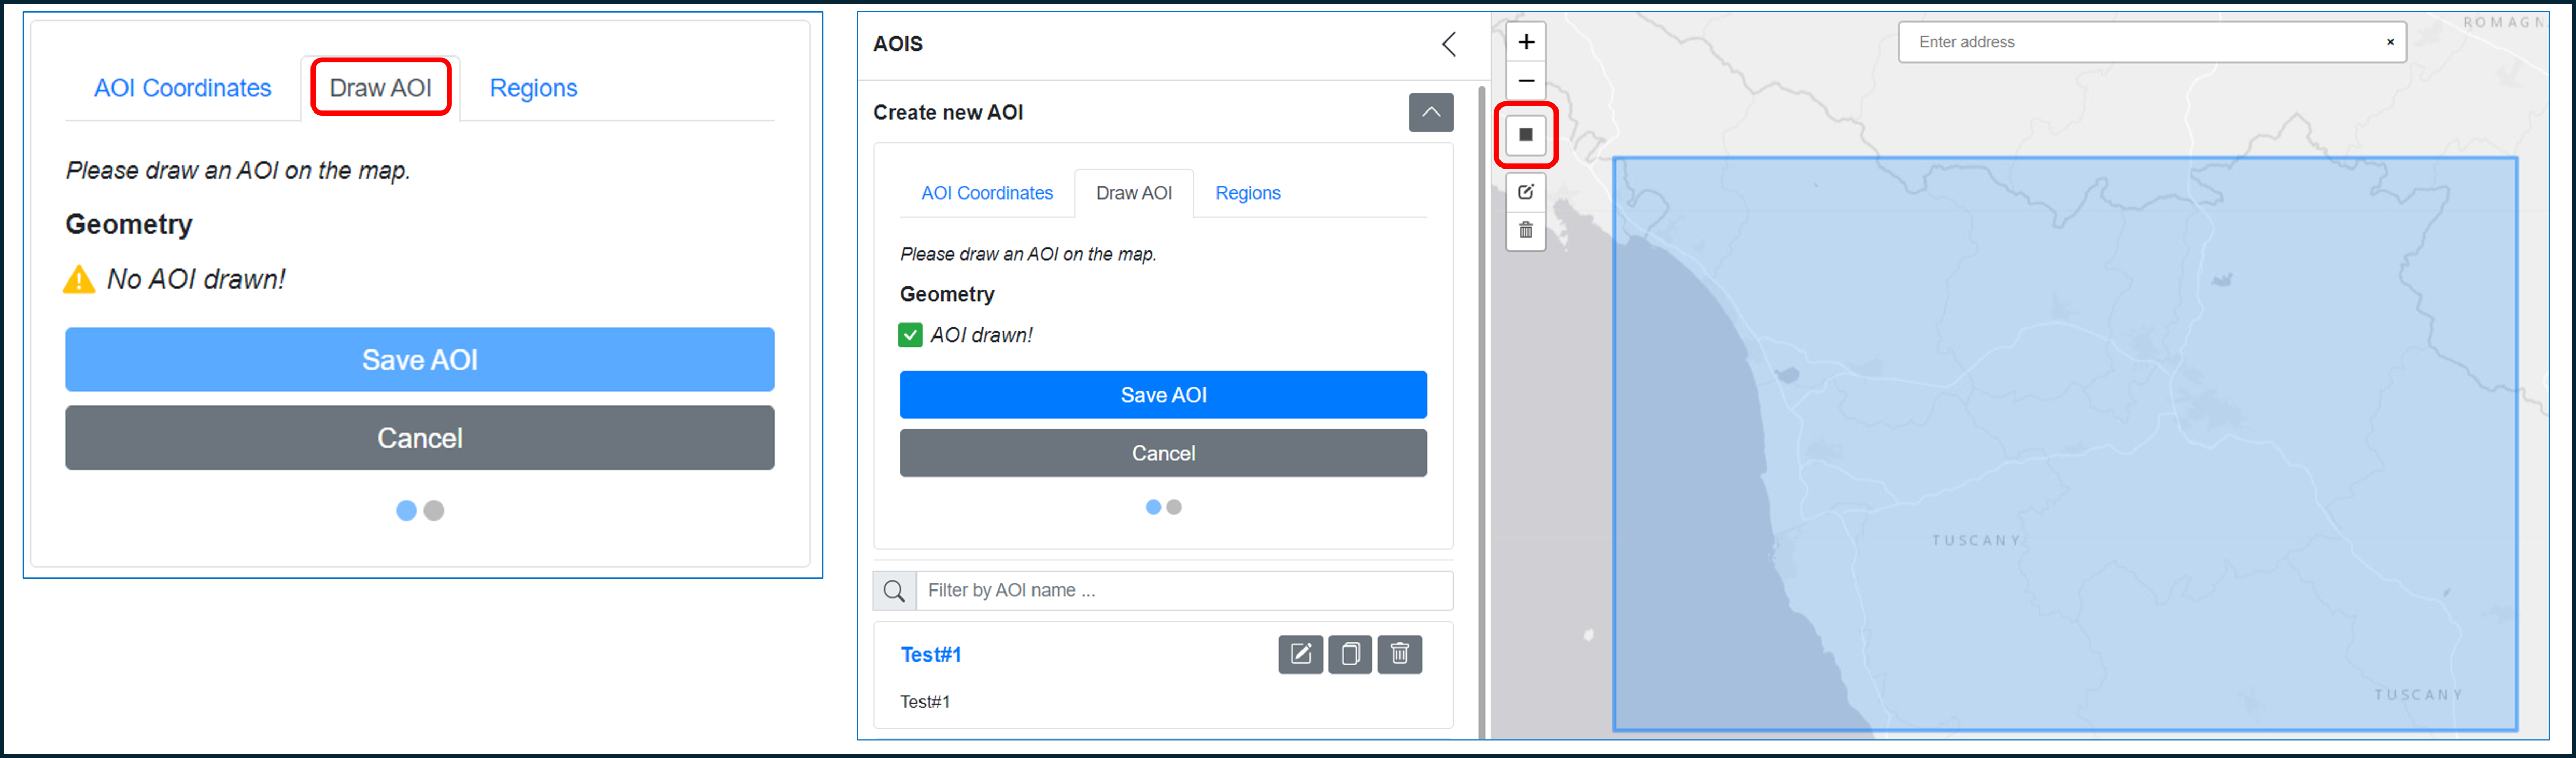
¶ Option 2 - Drawing AOI on a map:
Select the "Draw AOI" button (left graphic below). Click on the dark grey square on the map and draw a rectangle over the area for which you wish to retrieve flood information (right graphic below). Each AOI in the list can be further edited (using the pencil icon) or deleted (bin icon). When editing, users may change the rectangle dimensions or drag it rigidly (i.e. not changing its shape) across the map. Once the user is satisfied with the defined area, the button “Save AOI” will add the AOI to the list.
¶ Option 3 - Selecting a specific administrative region as an AOI:
Select the “Regions” button (left graphic below), and then through the dedicated drop-down menus choose the Country and the Region of interest. In this case the system will automatically draw a polygon fully encompassing the Region of interest (right graphic below). If the AOI is satisfactory, the “Save AOI” button will add the AOI to the list.

¶ 6.5.2 Download of available GFM output layers for AOIs
To download the GFM output layers, first select “Products” in the main banner (top graphic below), which brings up the Products form (bottom graphic below).
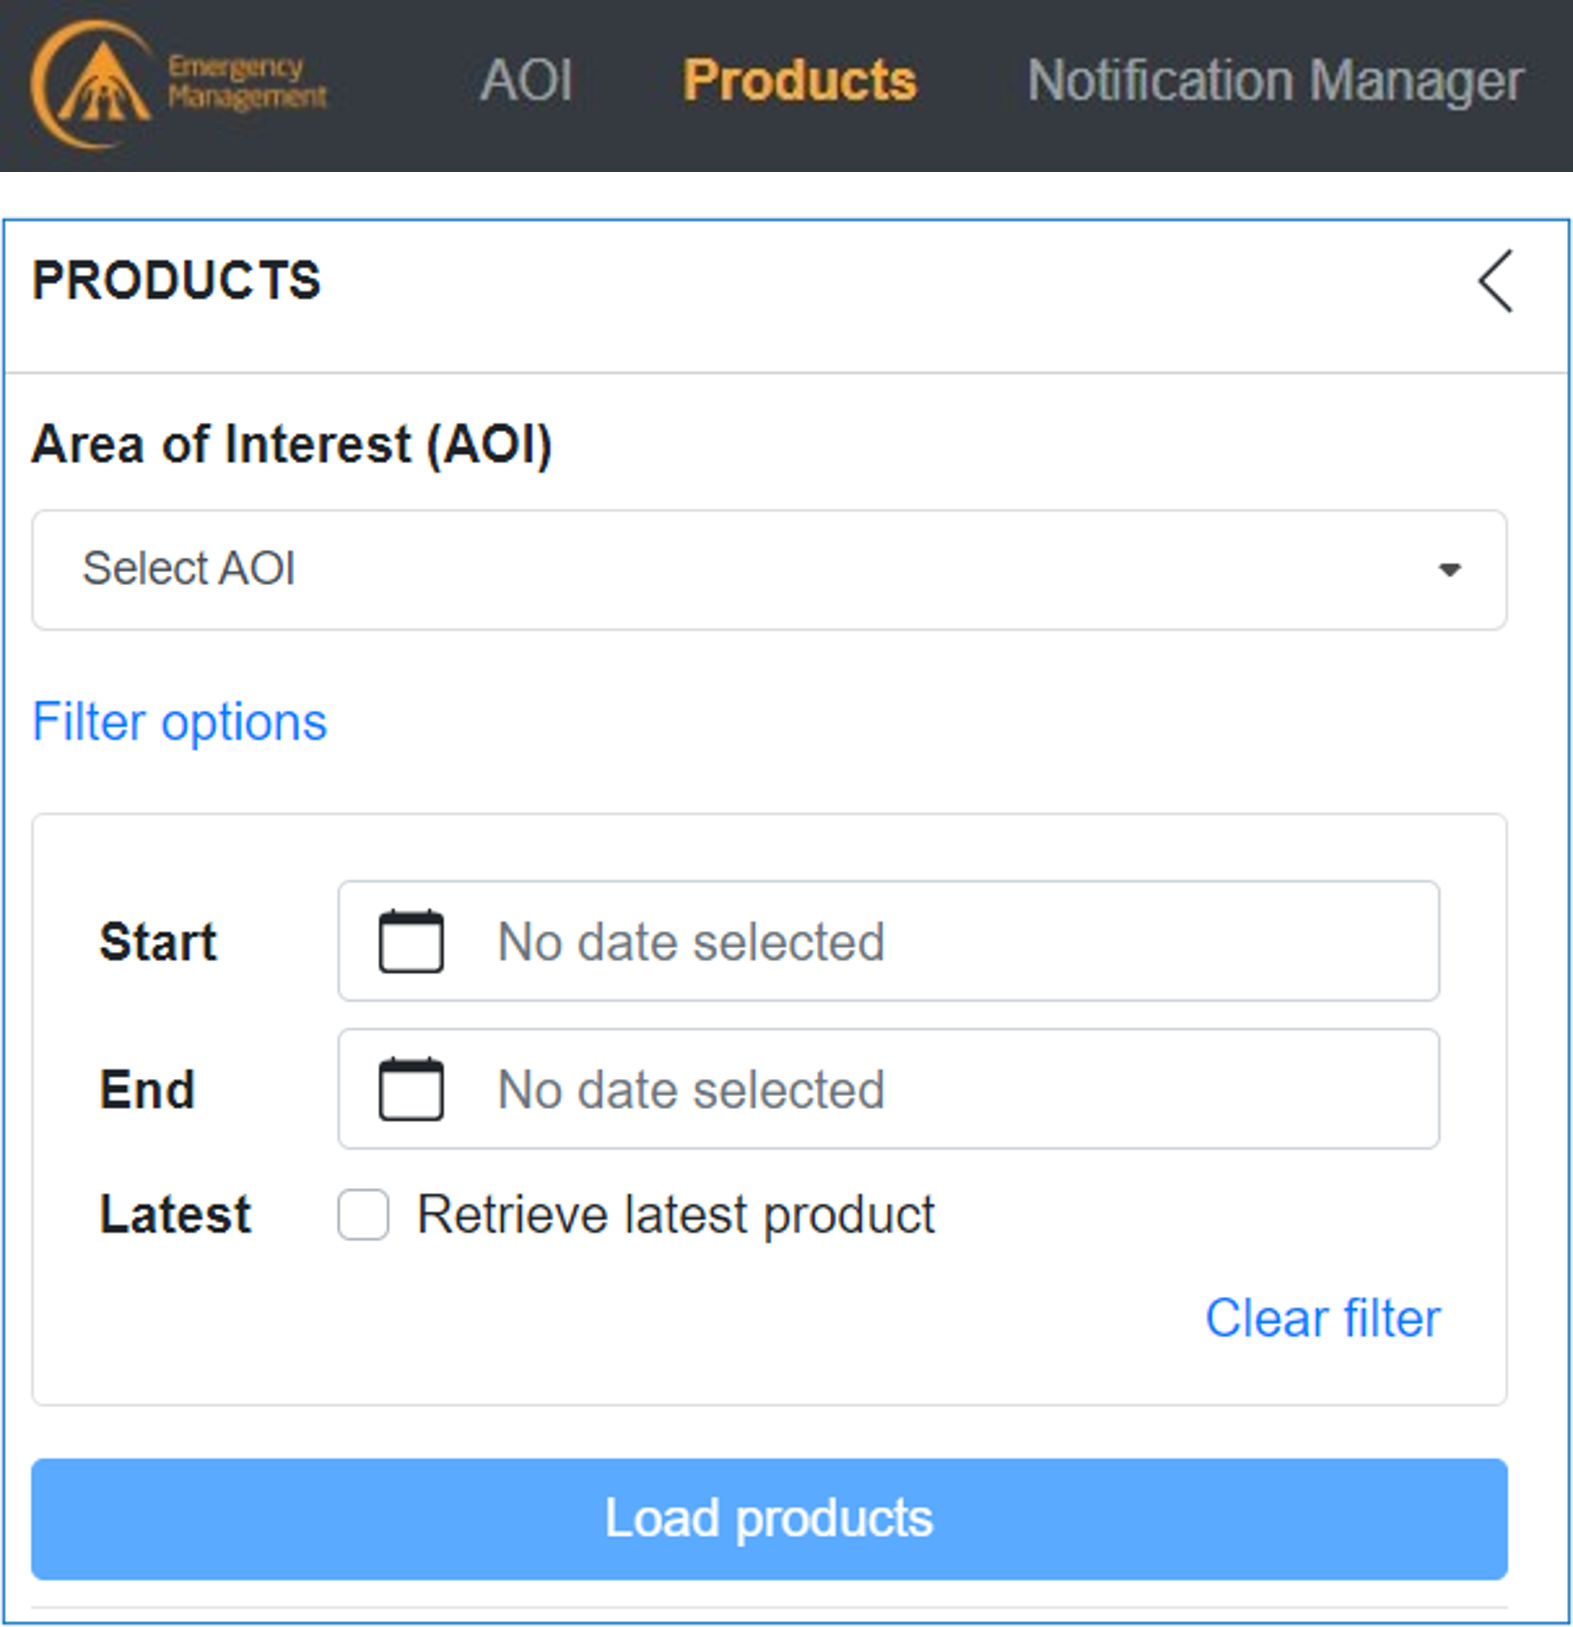
The GFM output layers for a specific AOI are first retrieved as follows:
| 1. Select an AOI through the drop down menu “Select an AOI” |
|
2. Choose a reference period, using one of the following options:
|
| 3. click on "Load products" |
The GFM output layers for an AOI can be downloaded using five options, described below:
| 1. Download a single GFM Product output layer for a specific date. |
| 2. Download selected GFM Product output layers for a whole time-series. |
| 3. Download selected GFM Product output layers for a specific date. |
| 4. Download all GFM Product output layers for multiple dates. |
| 5. Download the maximum flood extent. |
¶ 6.5.2.1 Download a single GFM output layer for a specific date
To download a single GFM output layer, users must click on a specific product (left graphic below, red arrow), select the output layer (right graphic below), and click Download (right graphic below, red circle). Note: (a) the length of the selected time-frame cannot be longer than 6 months; (b) this feature is not available if "Retrieve latest product" filter was ticked.
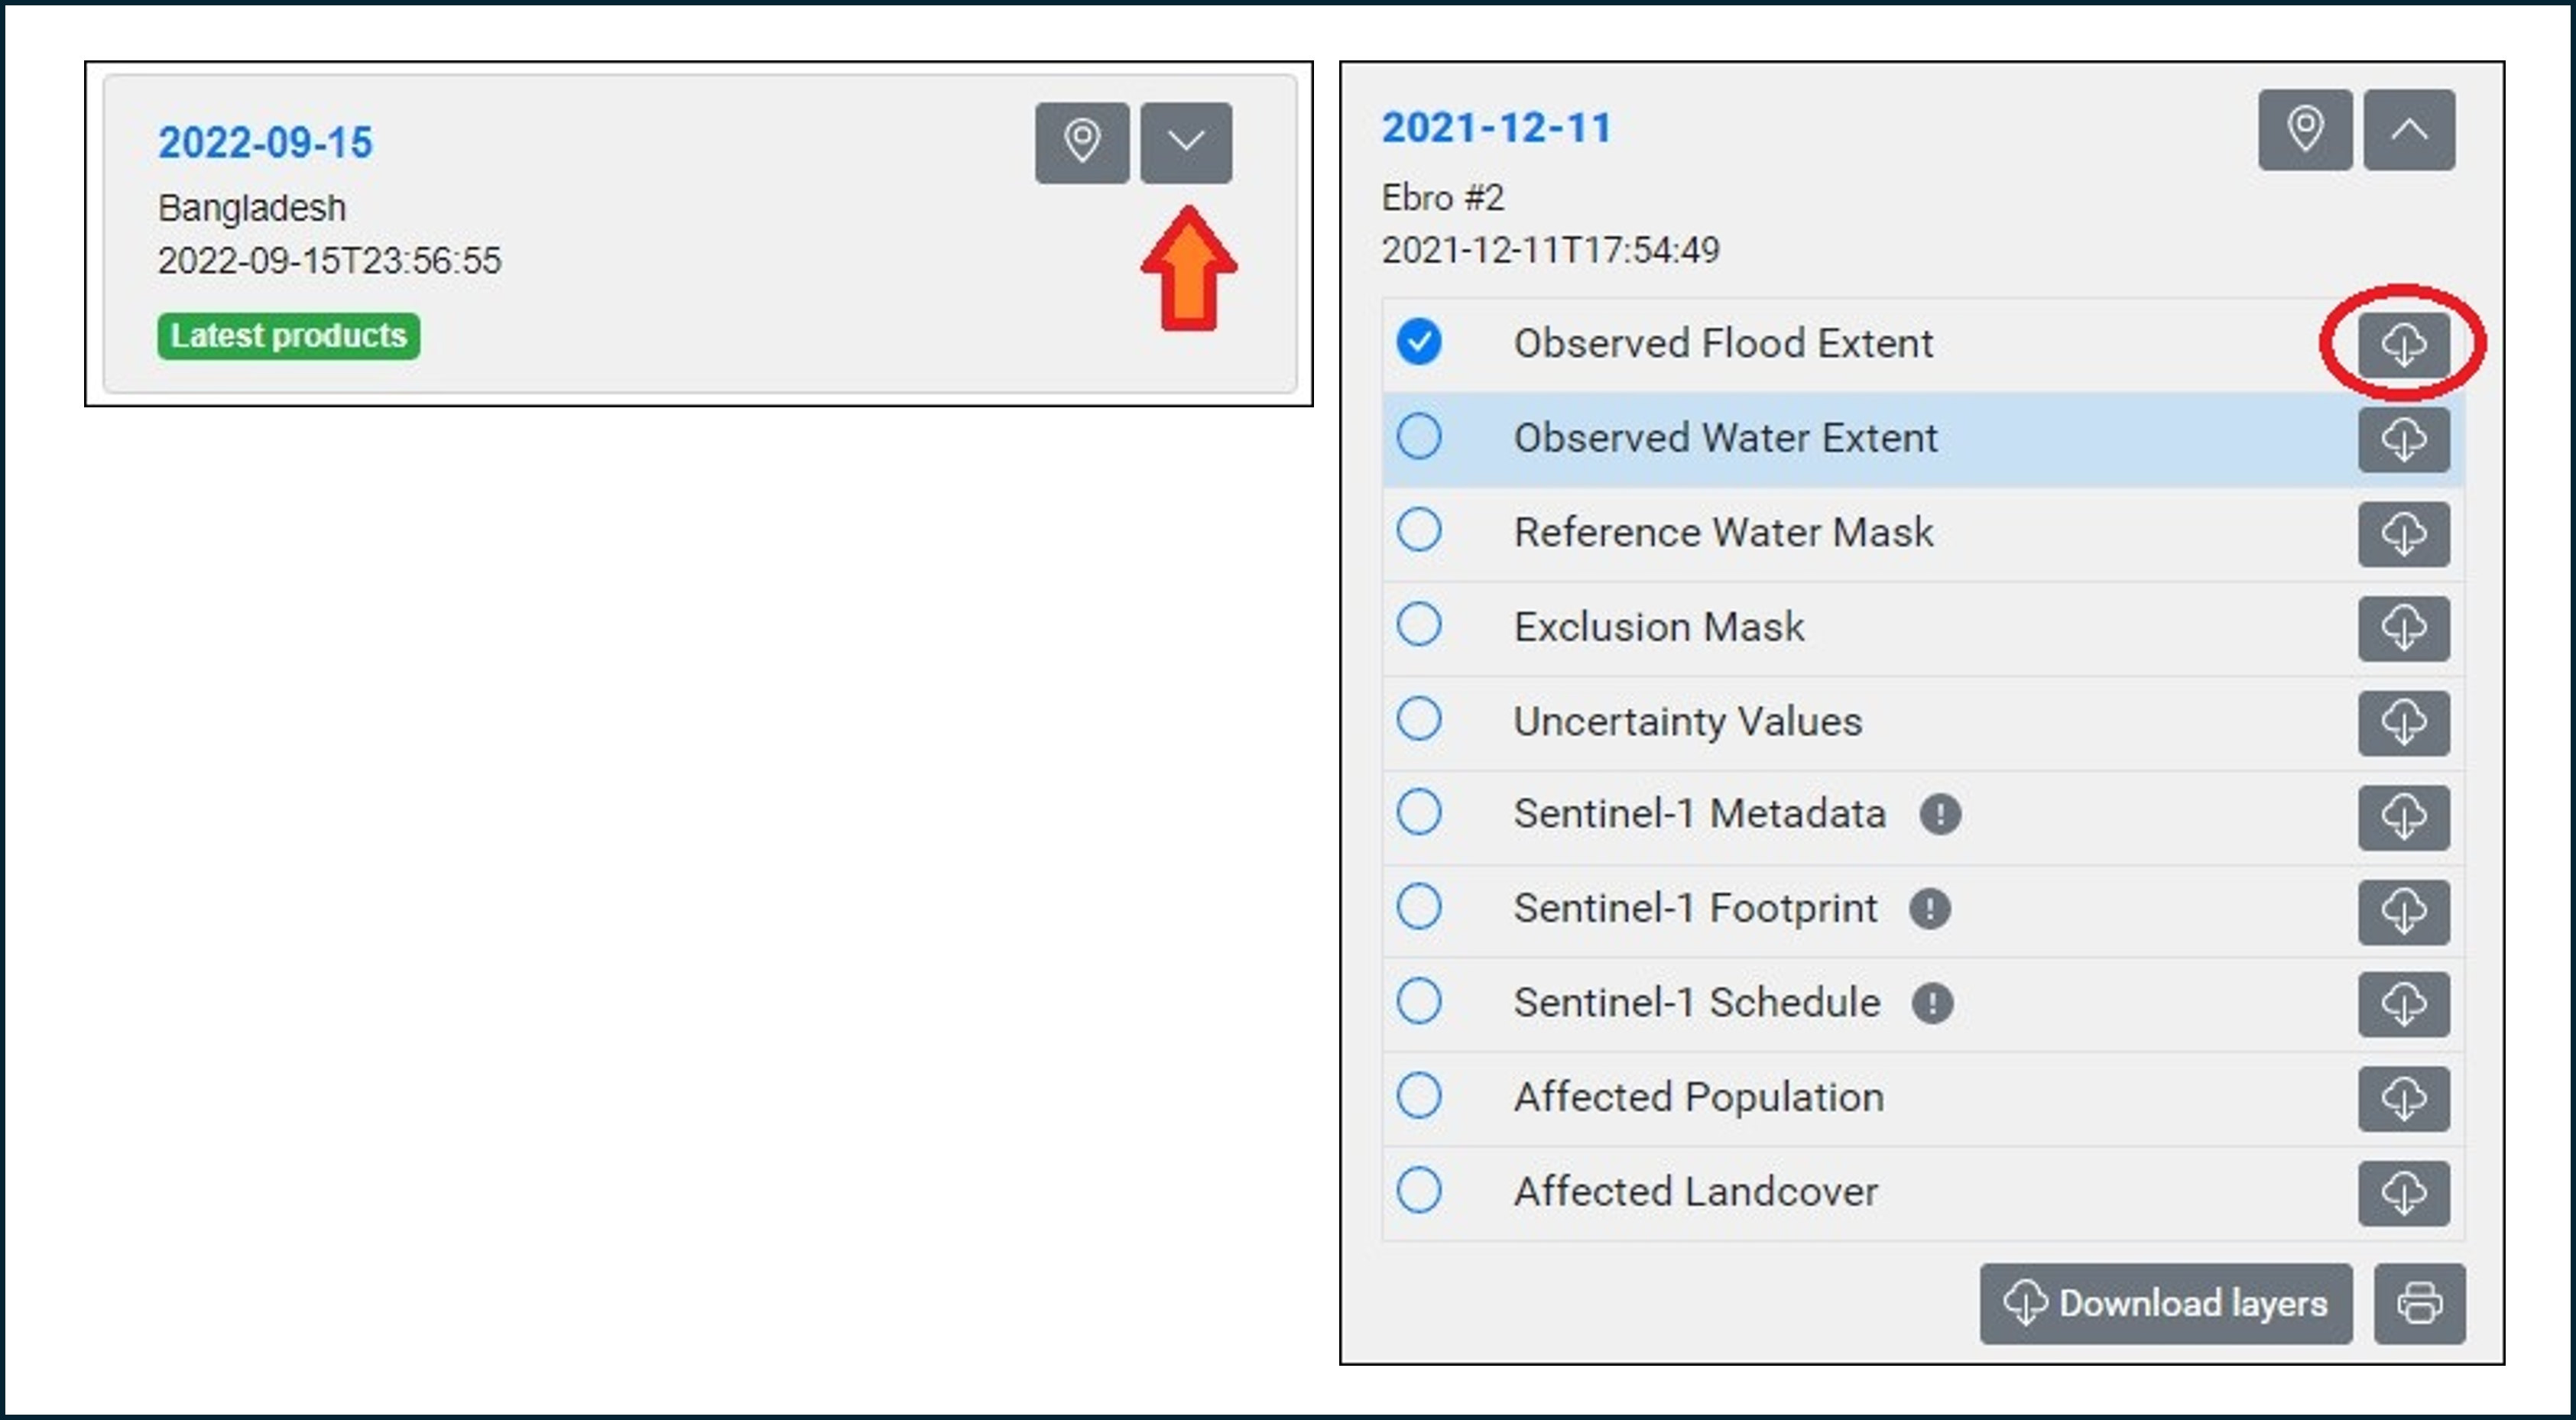
Note: (a) The length of the selected timeframe cannot be longer than 2 months; (b) This feature is not available if the "Retrieve latest product" filter has been ticked.
¶ 6.5.2.2 Download selected GFM output layers for a defined time-period
| 1. Choose the AOI and the reference period (as shown above). |
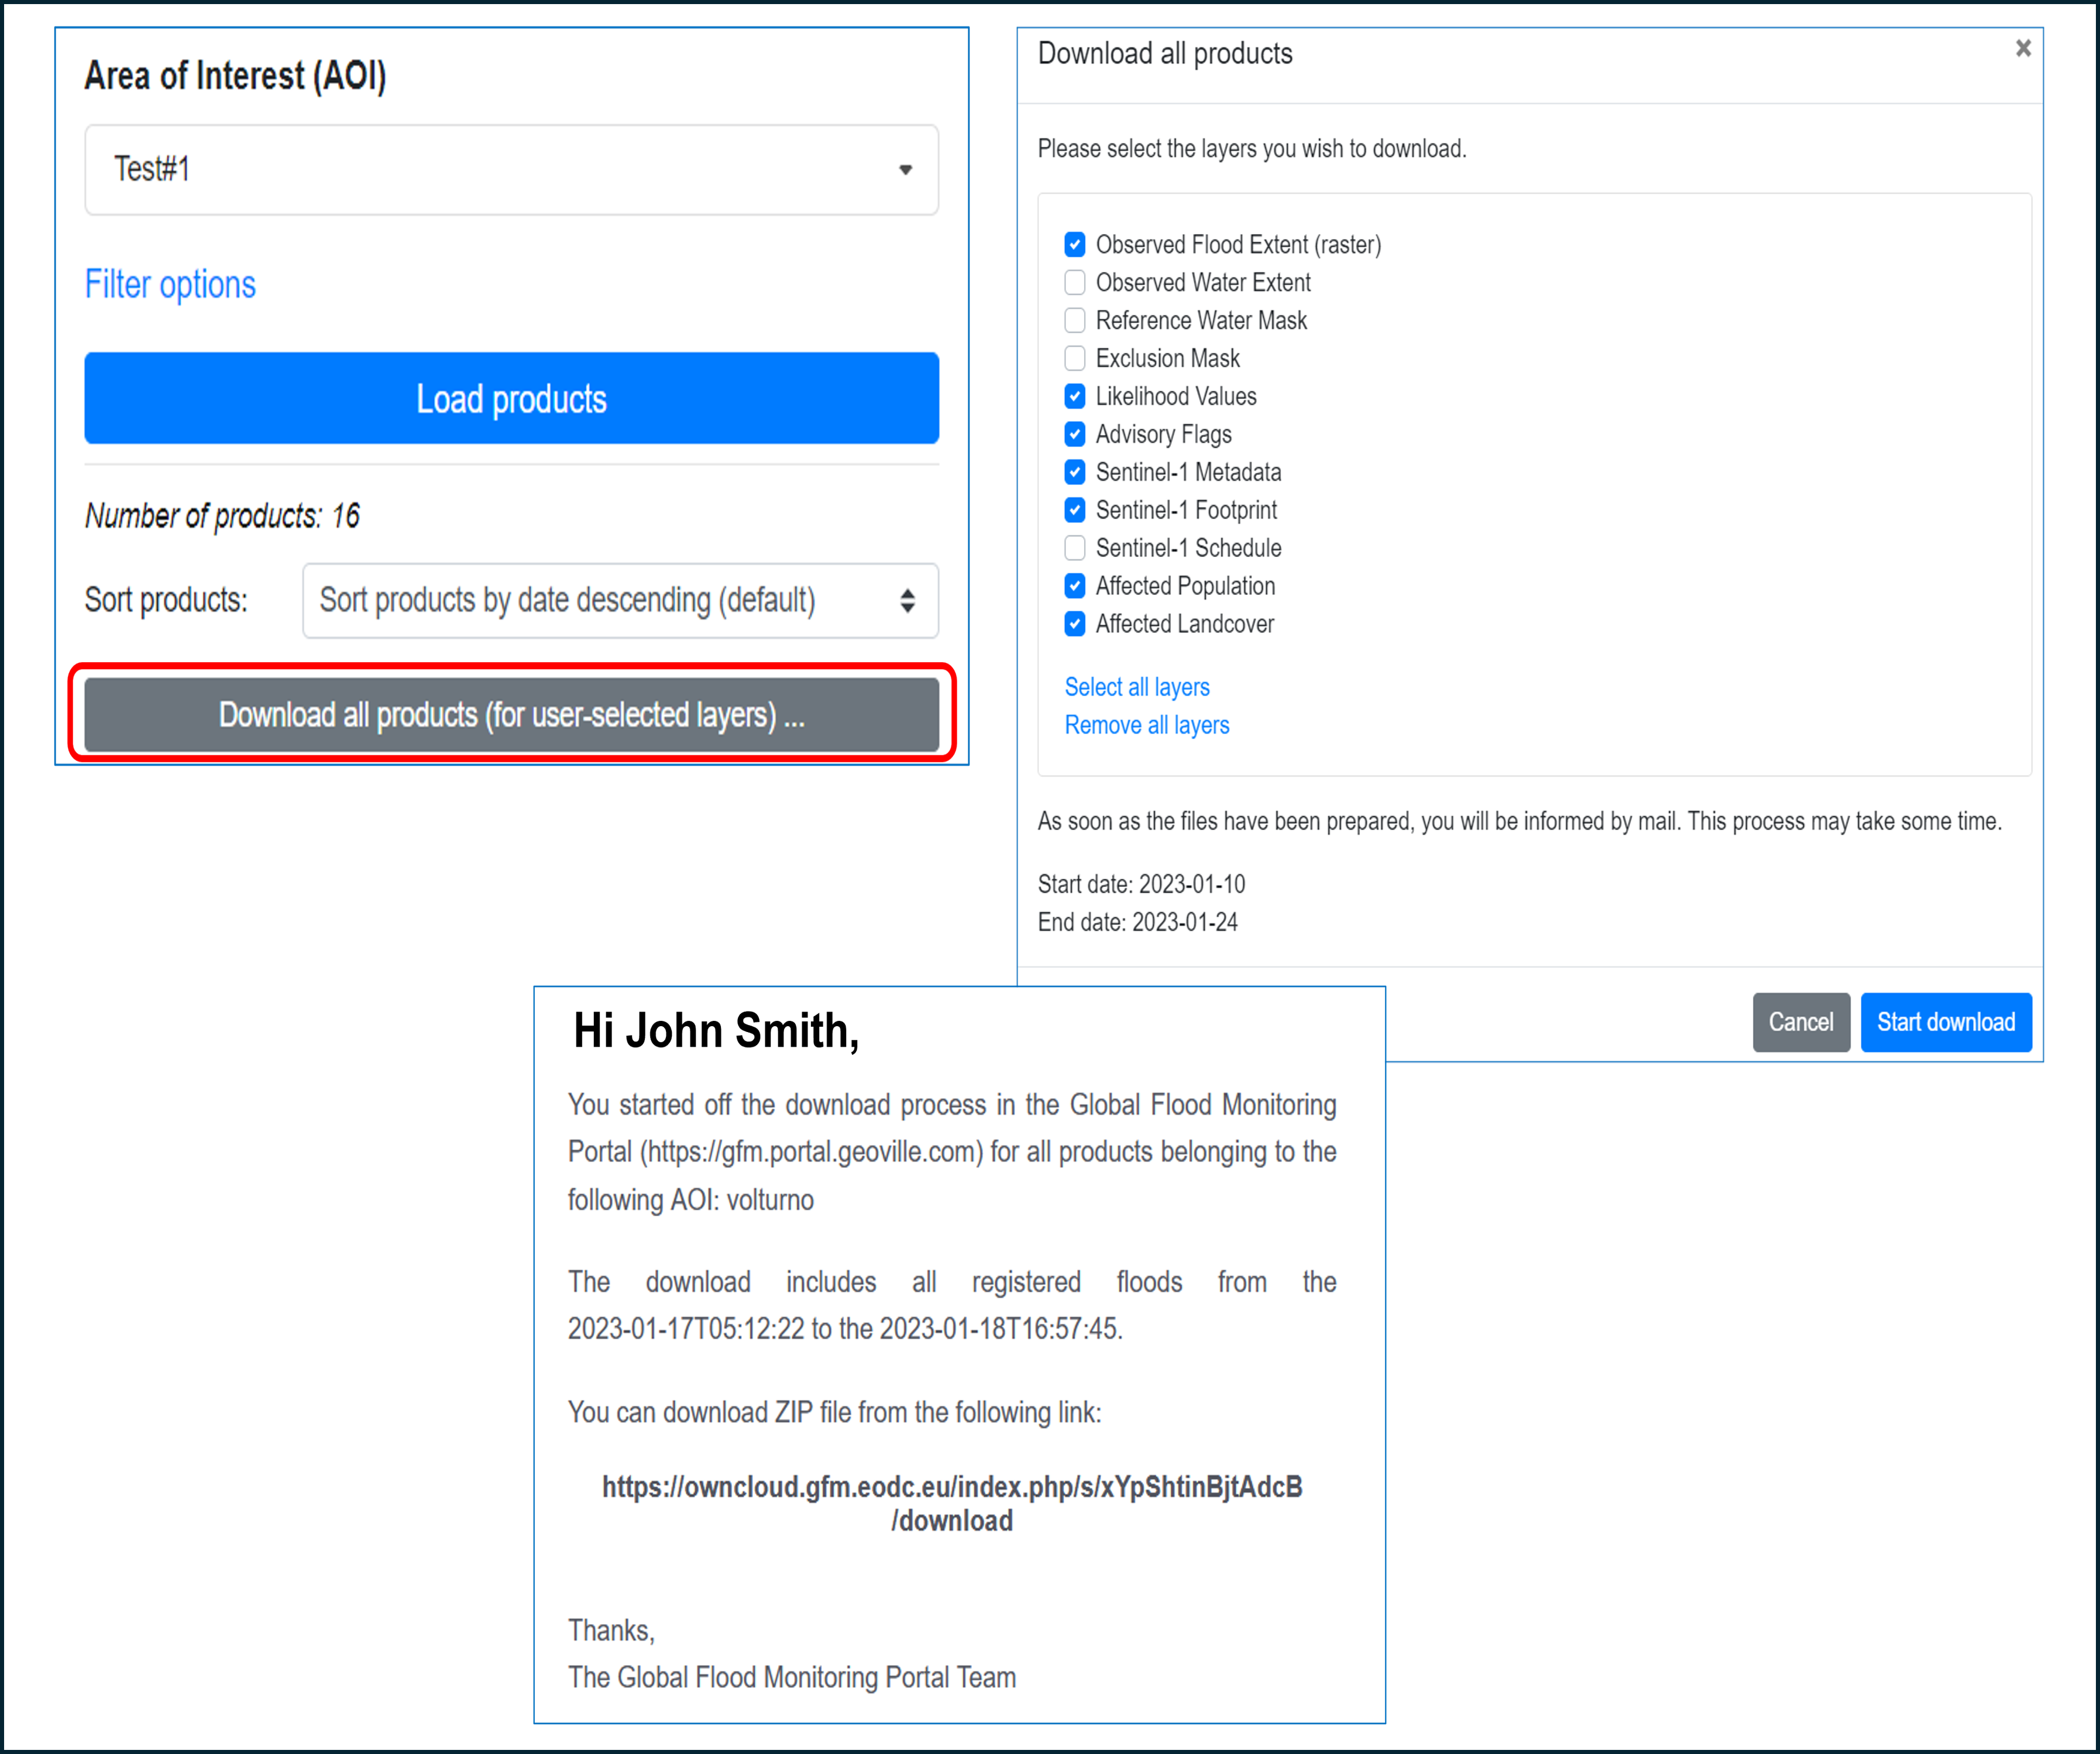
| 2. Click on “Download all products (for user-selected layers)”, as shown below. |
|
3. In the pop-up window (shown below):
|
| 4. As soon as the bundle of the requested product output layers will be ready, an email (see example below), including the URL to download the bundle, will be sent out. |
Note: (a) The length of the selected timeframe cannot be longer than 2 months; (b) This feature is not available if the "Retrieve latest product" filter has been ticked.
¶ 6.5.2.3 Download selected GFM output layers for a specific date
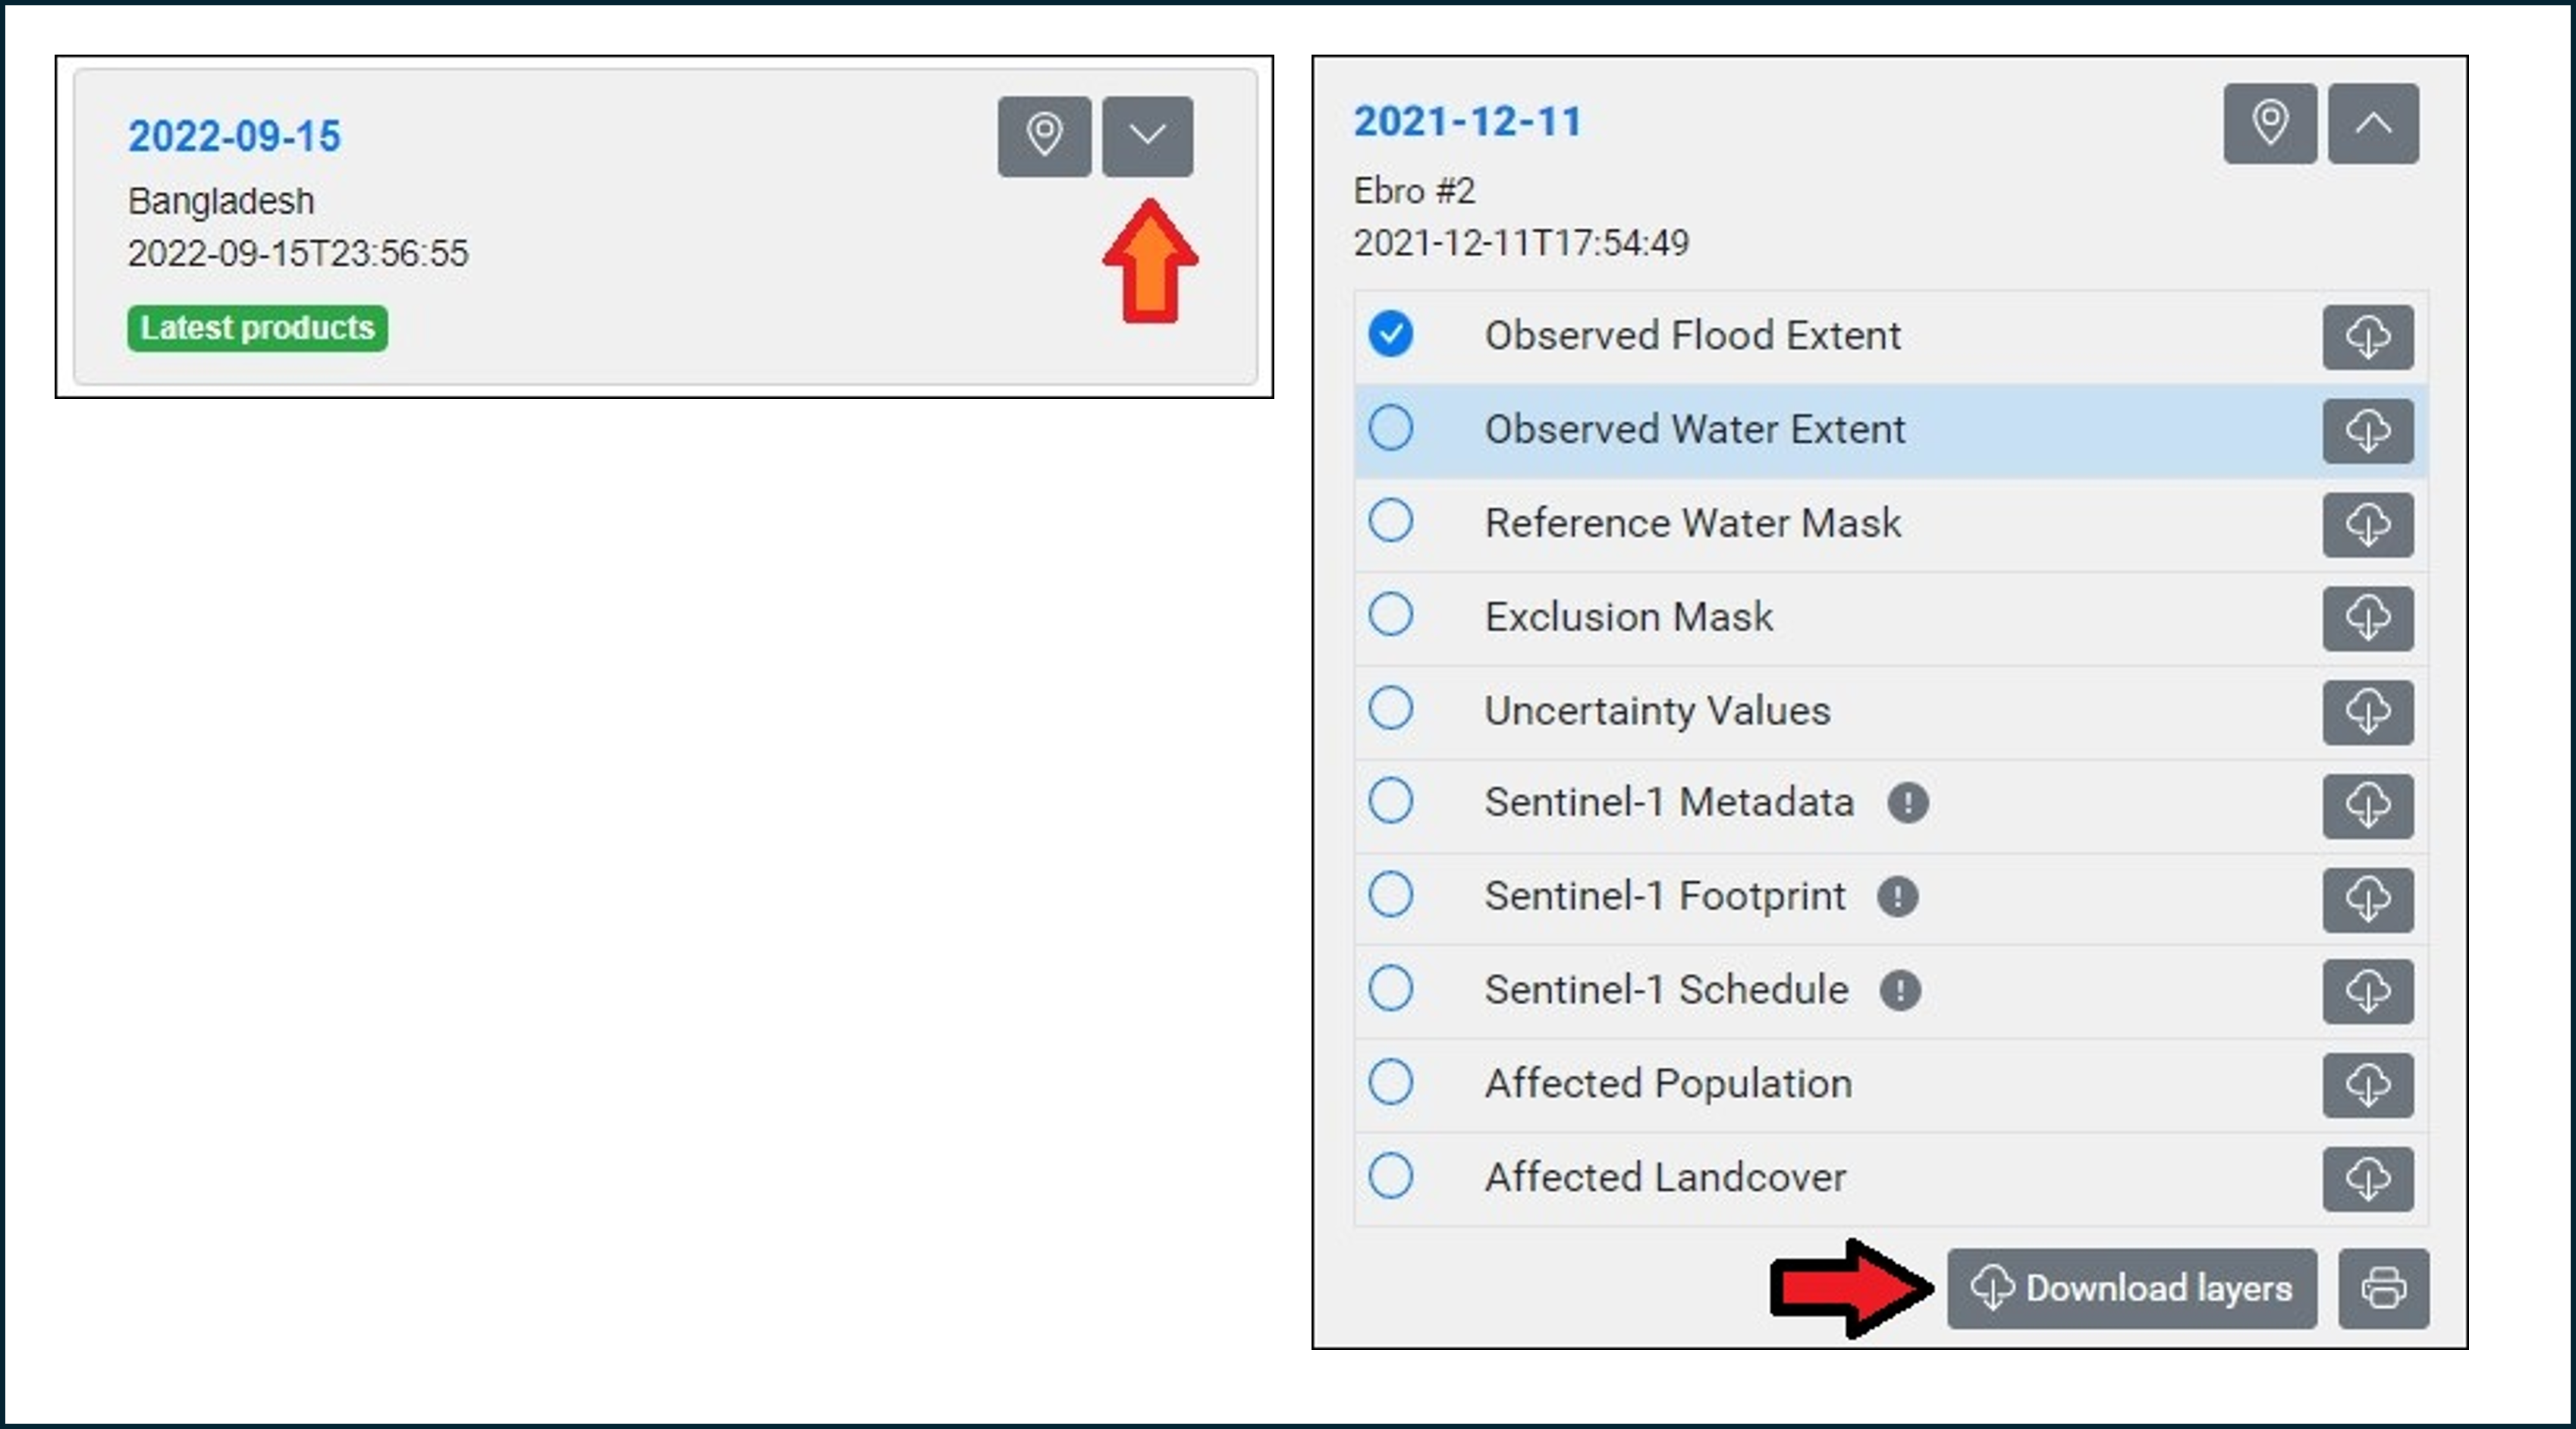
To download selected GFM output layers for a specific date, first select the output layers (left graphic below, red arrow), and select “Download layers” (right graphic below, red arrow).
¶ 6.5.2.4 Download all GFM output layers for multiple dates
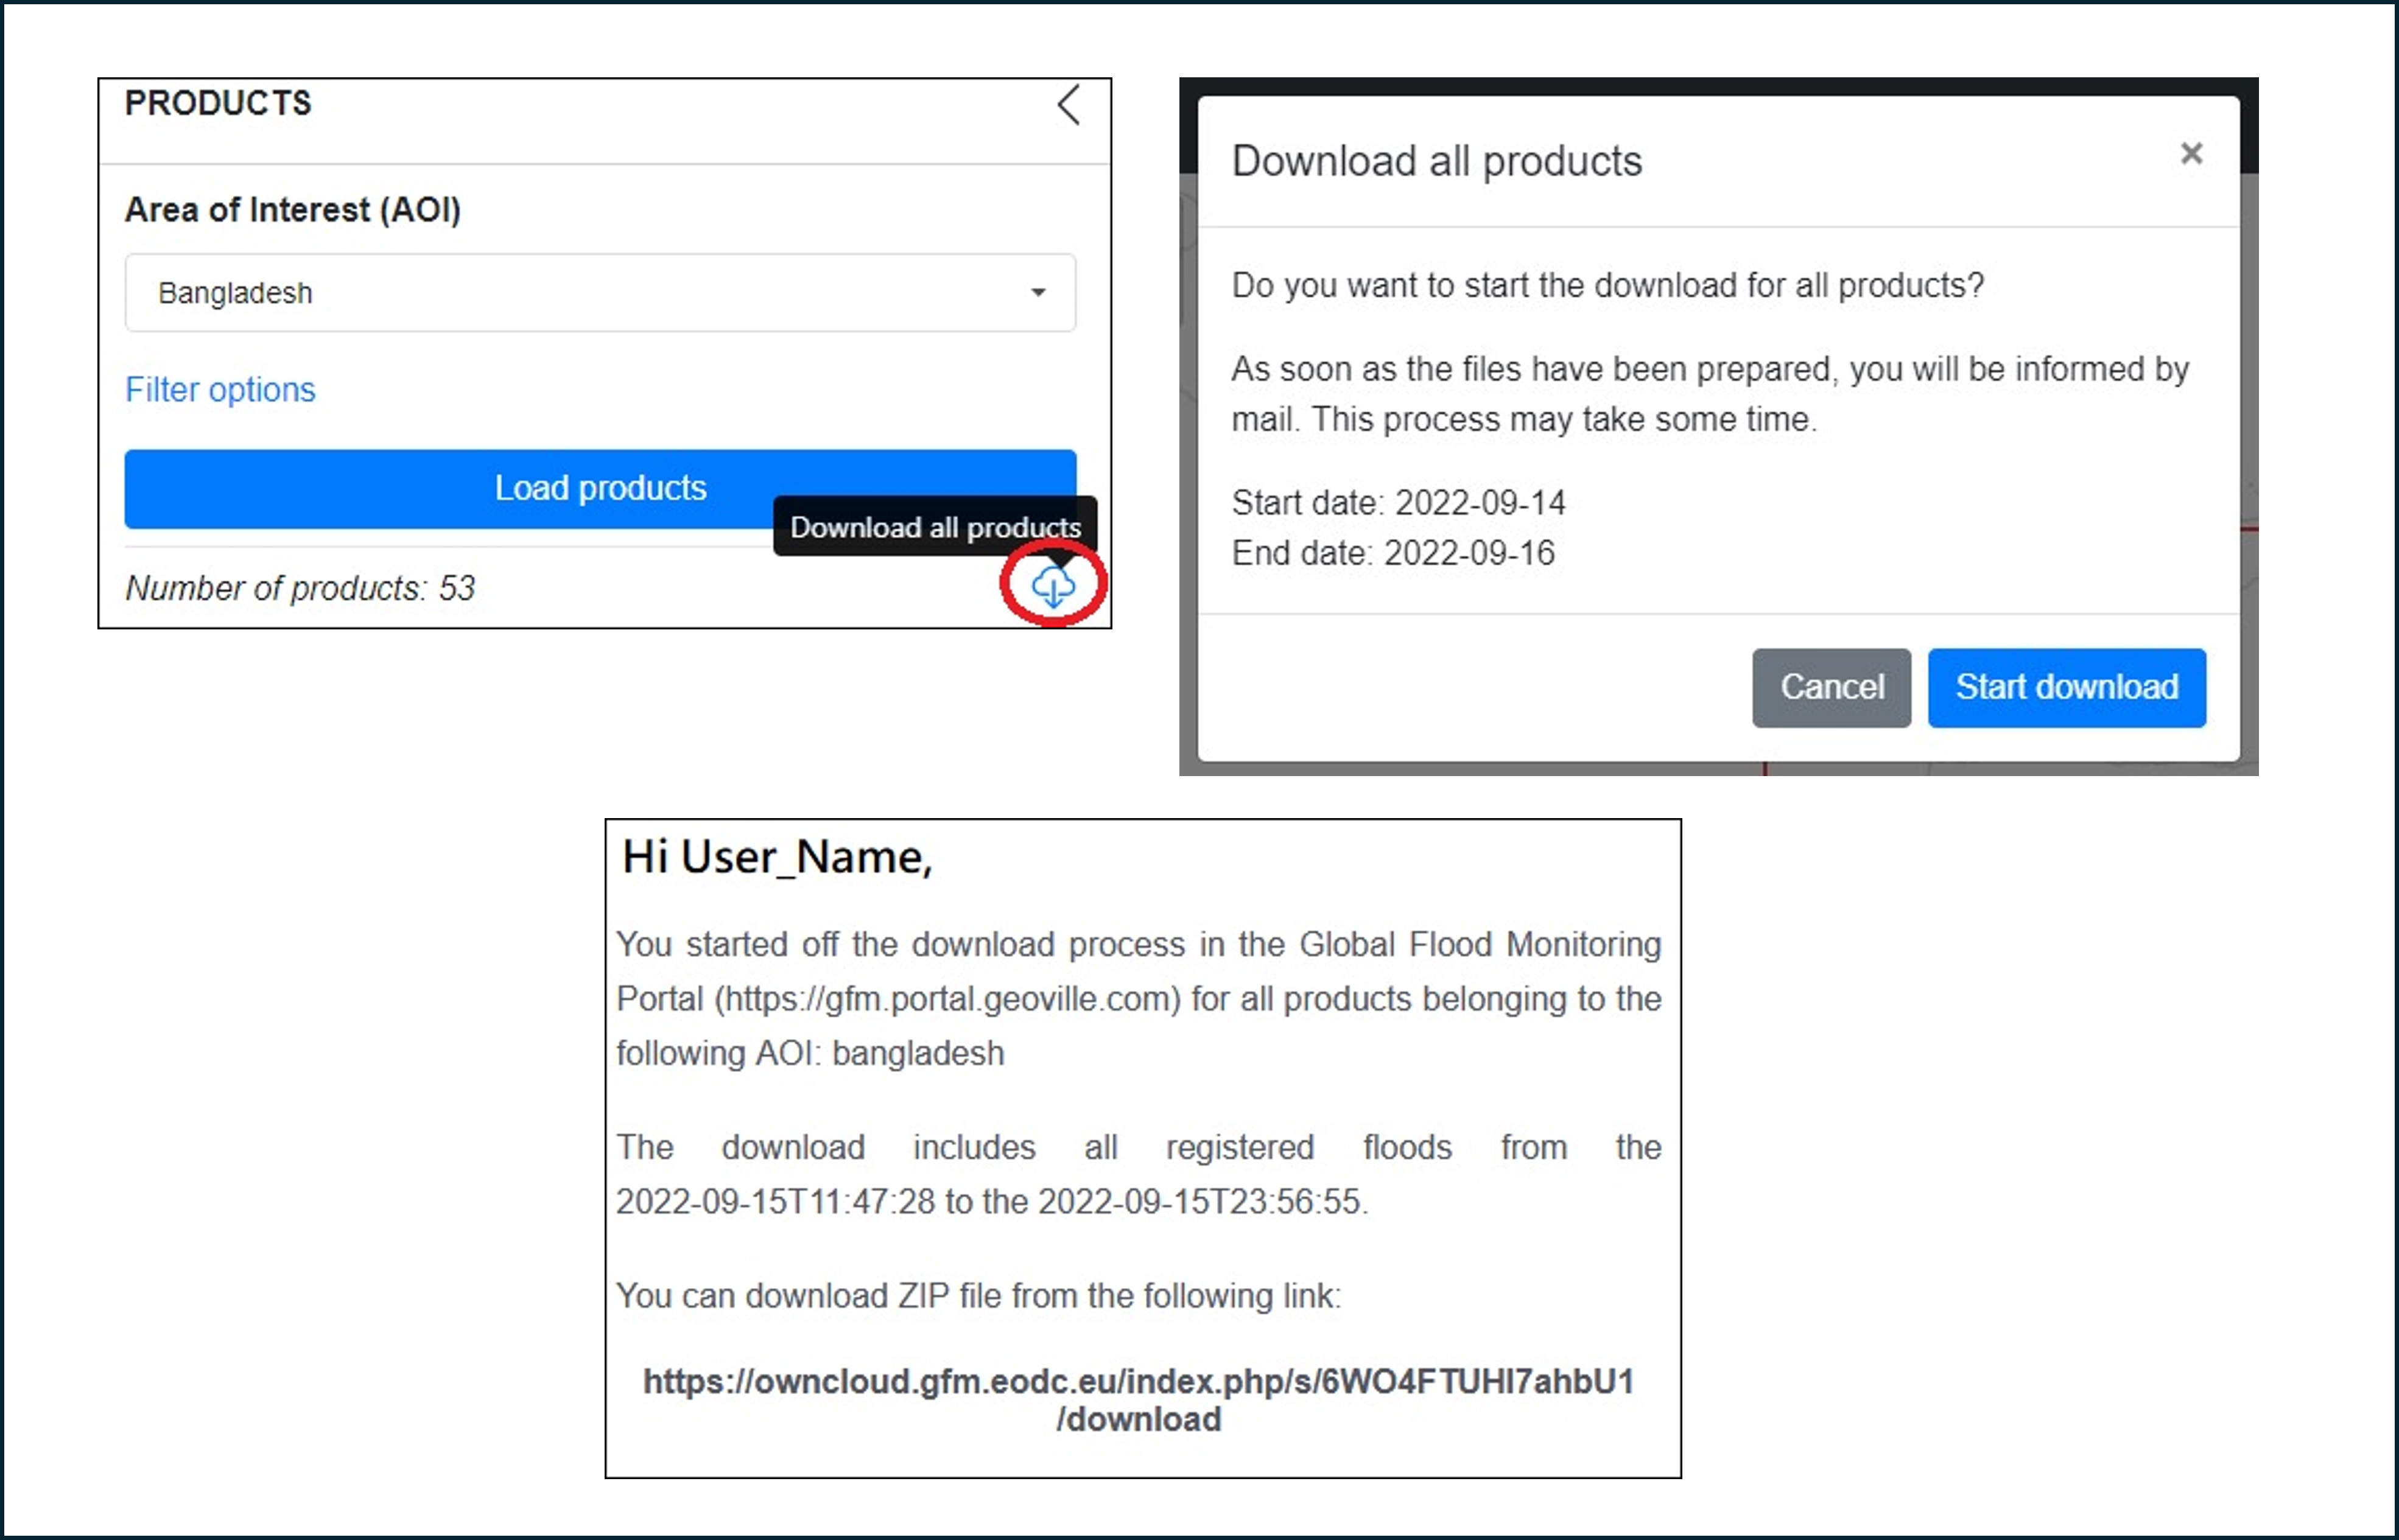
| 1. If multiple dates are available, users can download all GFM output layers for all dates, by clicking on the button “Download all products” (top left graphic below, red circle). |
| 2. The system will then display a message asking the user to confirm the submission of the query (top right graphic below). The query is confirmed by pressing “Start download”. |
| 3. The system will start assembling the data package. Once completed, an e-mail is sent out providing the link to download the requested dataset (bottom graphic below). |
Note: (a) The length of the selected timeframe cannot be longer than 2 months; (b) This feature is not available if the "Retrieve latest product" filter has been ticked.
¶ 6.5.2.5 Download the maximum flood extent
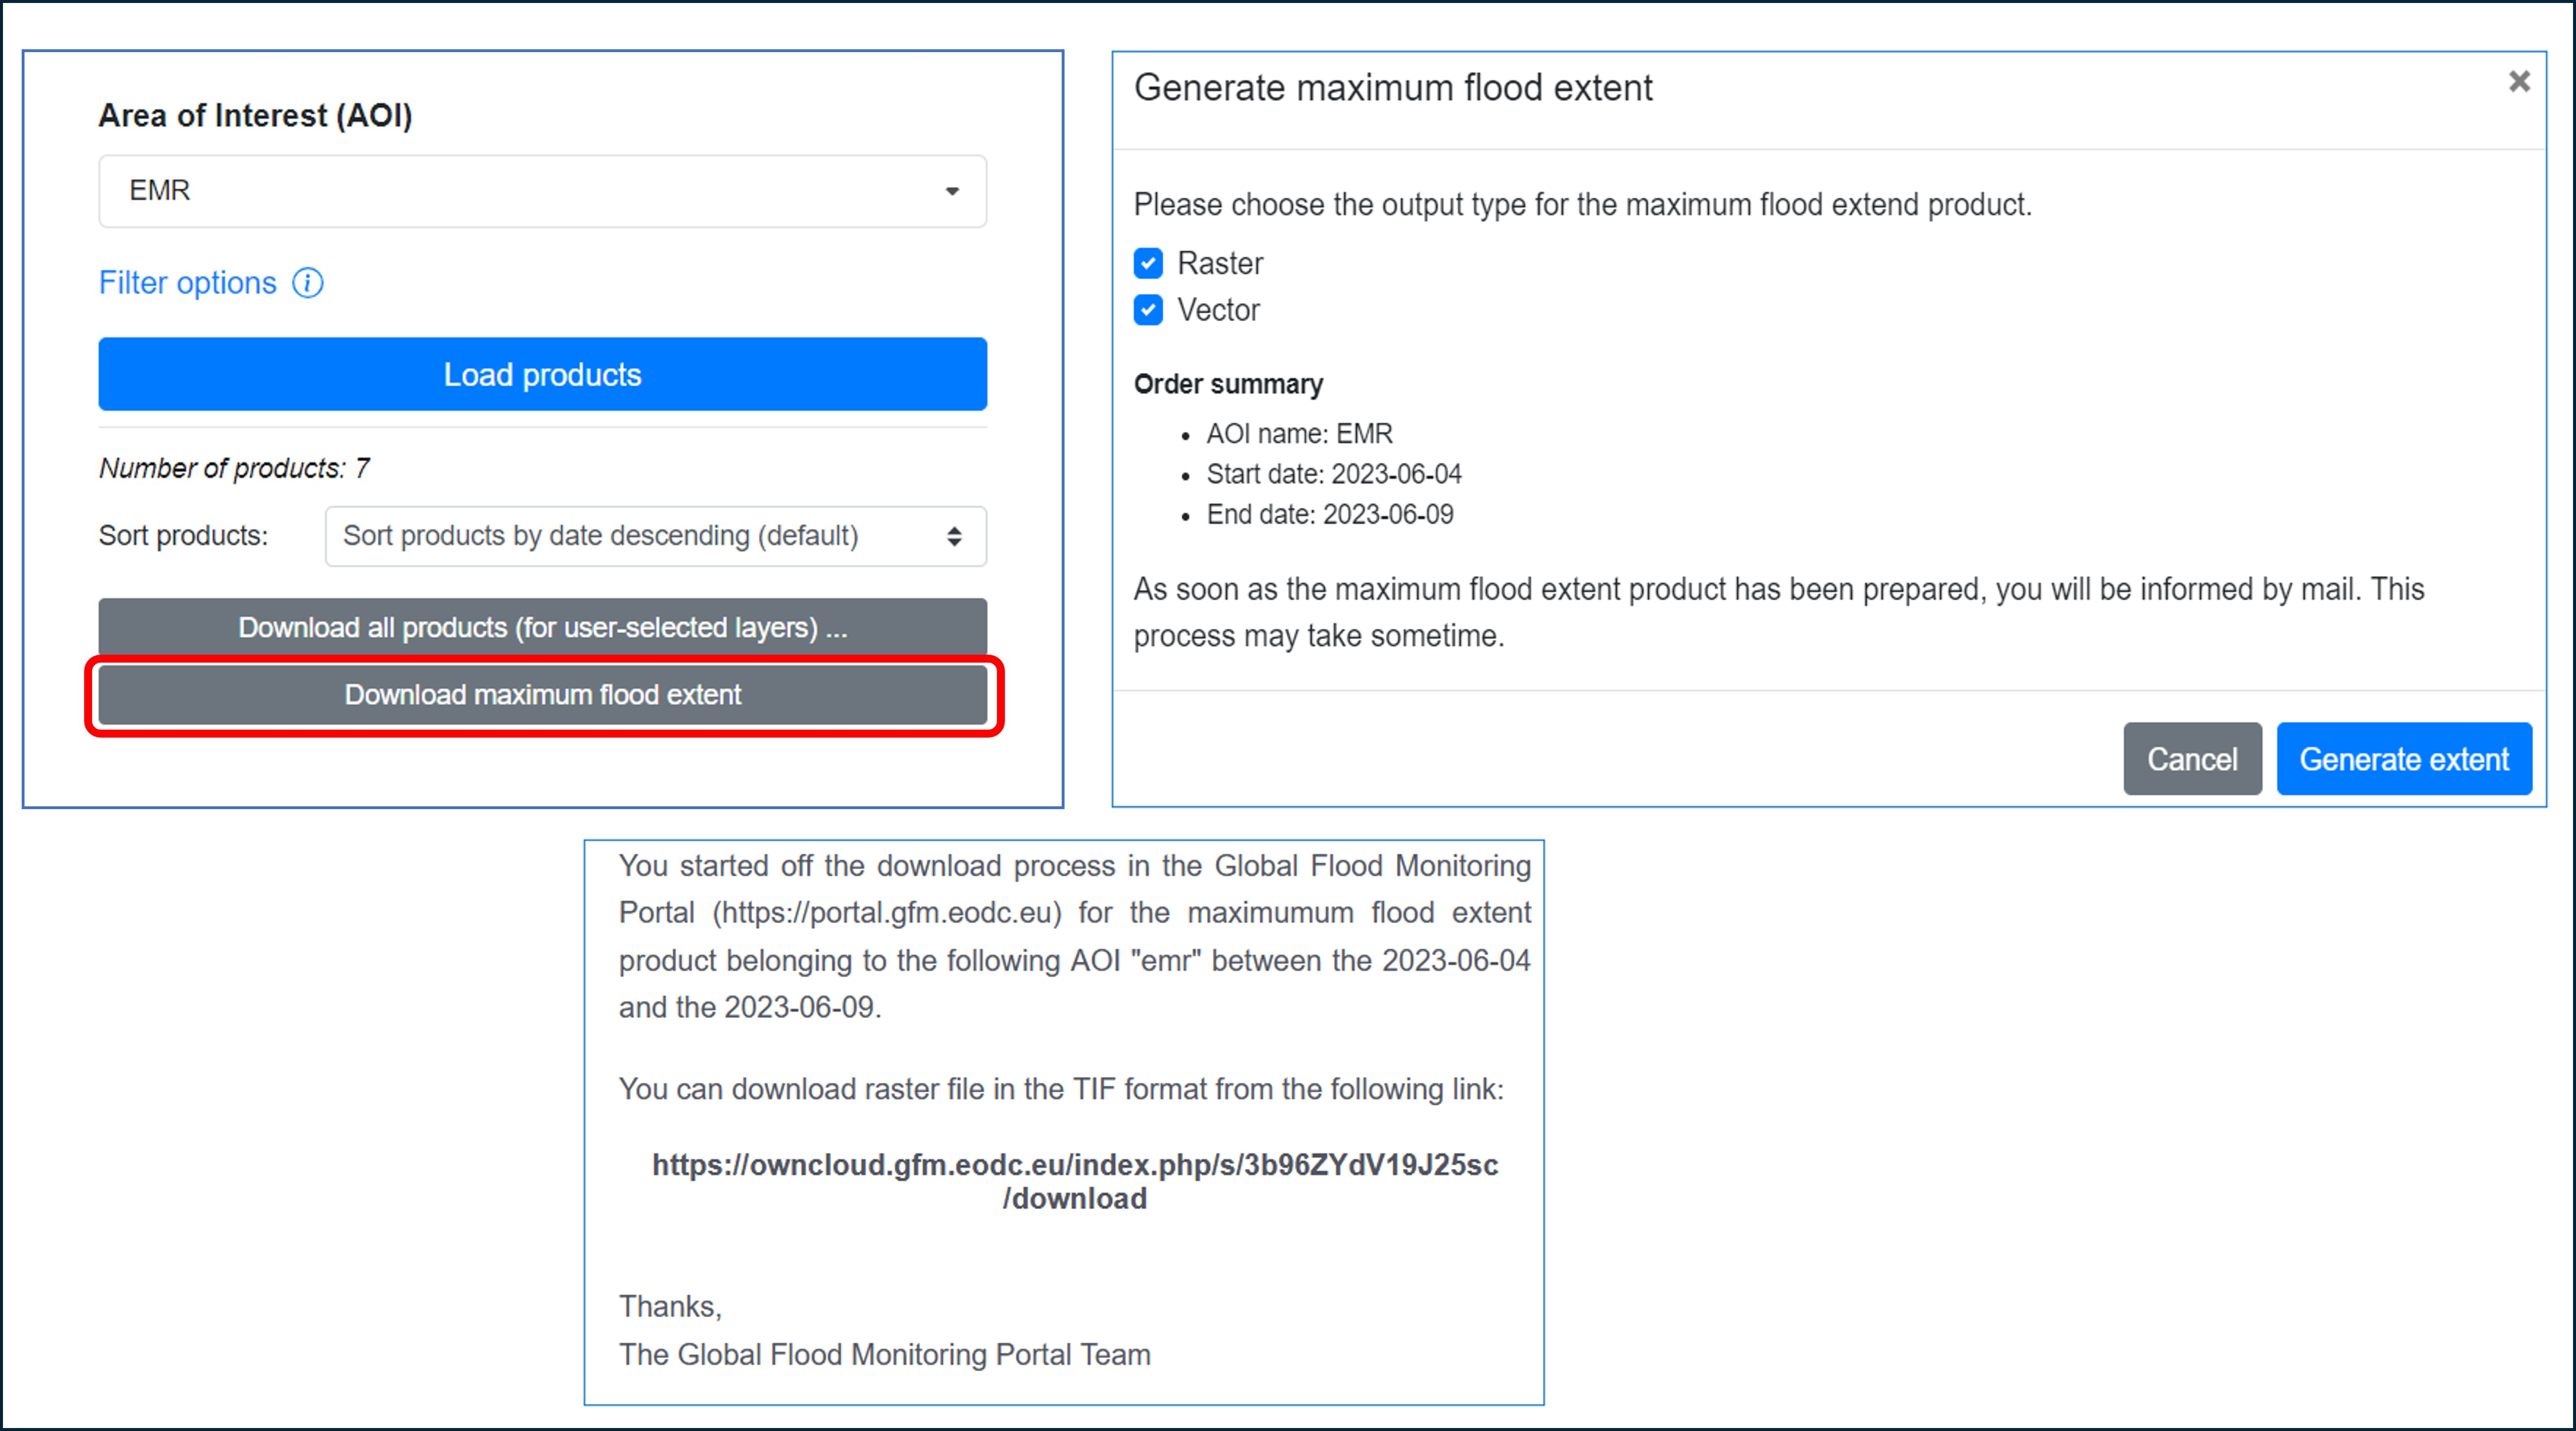
| 1. The maximum flood extent is the composite of all Observed Flood Extent output layers available for a user-defined period. A request for the maximum flood extent for an AOI is made by selecting “Download maximum flood extent” (top left graphic below). |
|
2. A pop-up window (top right graphic below) will then display:
|
| 3. By clicking on “Generate extent”, the system will automatically submit the query to the GFM production servers and a confirmation e-mail will be sent to the user. |
| 4. As soon as the computational process will be completed, the system will send a second mail, containing the URL to download the data (bottom graphic below). |
Note: (a) The length of the selected timeframe cannot be longer than 2 months; (b) This feature is not available if the "Retrieve latest product" filter has been ticked.
¶ 6.5.3 Generation of summary report for AOIs, for selected GFM output layers
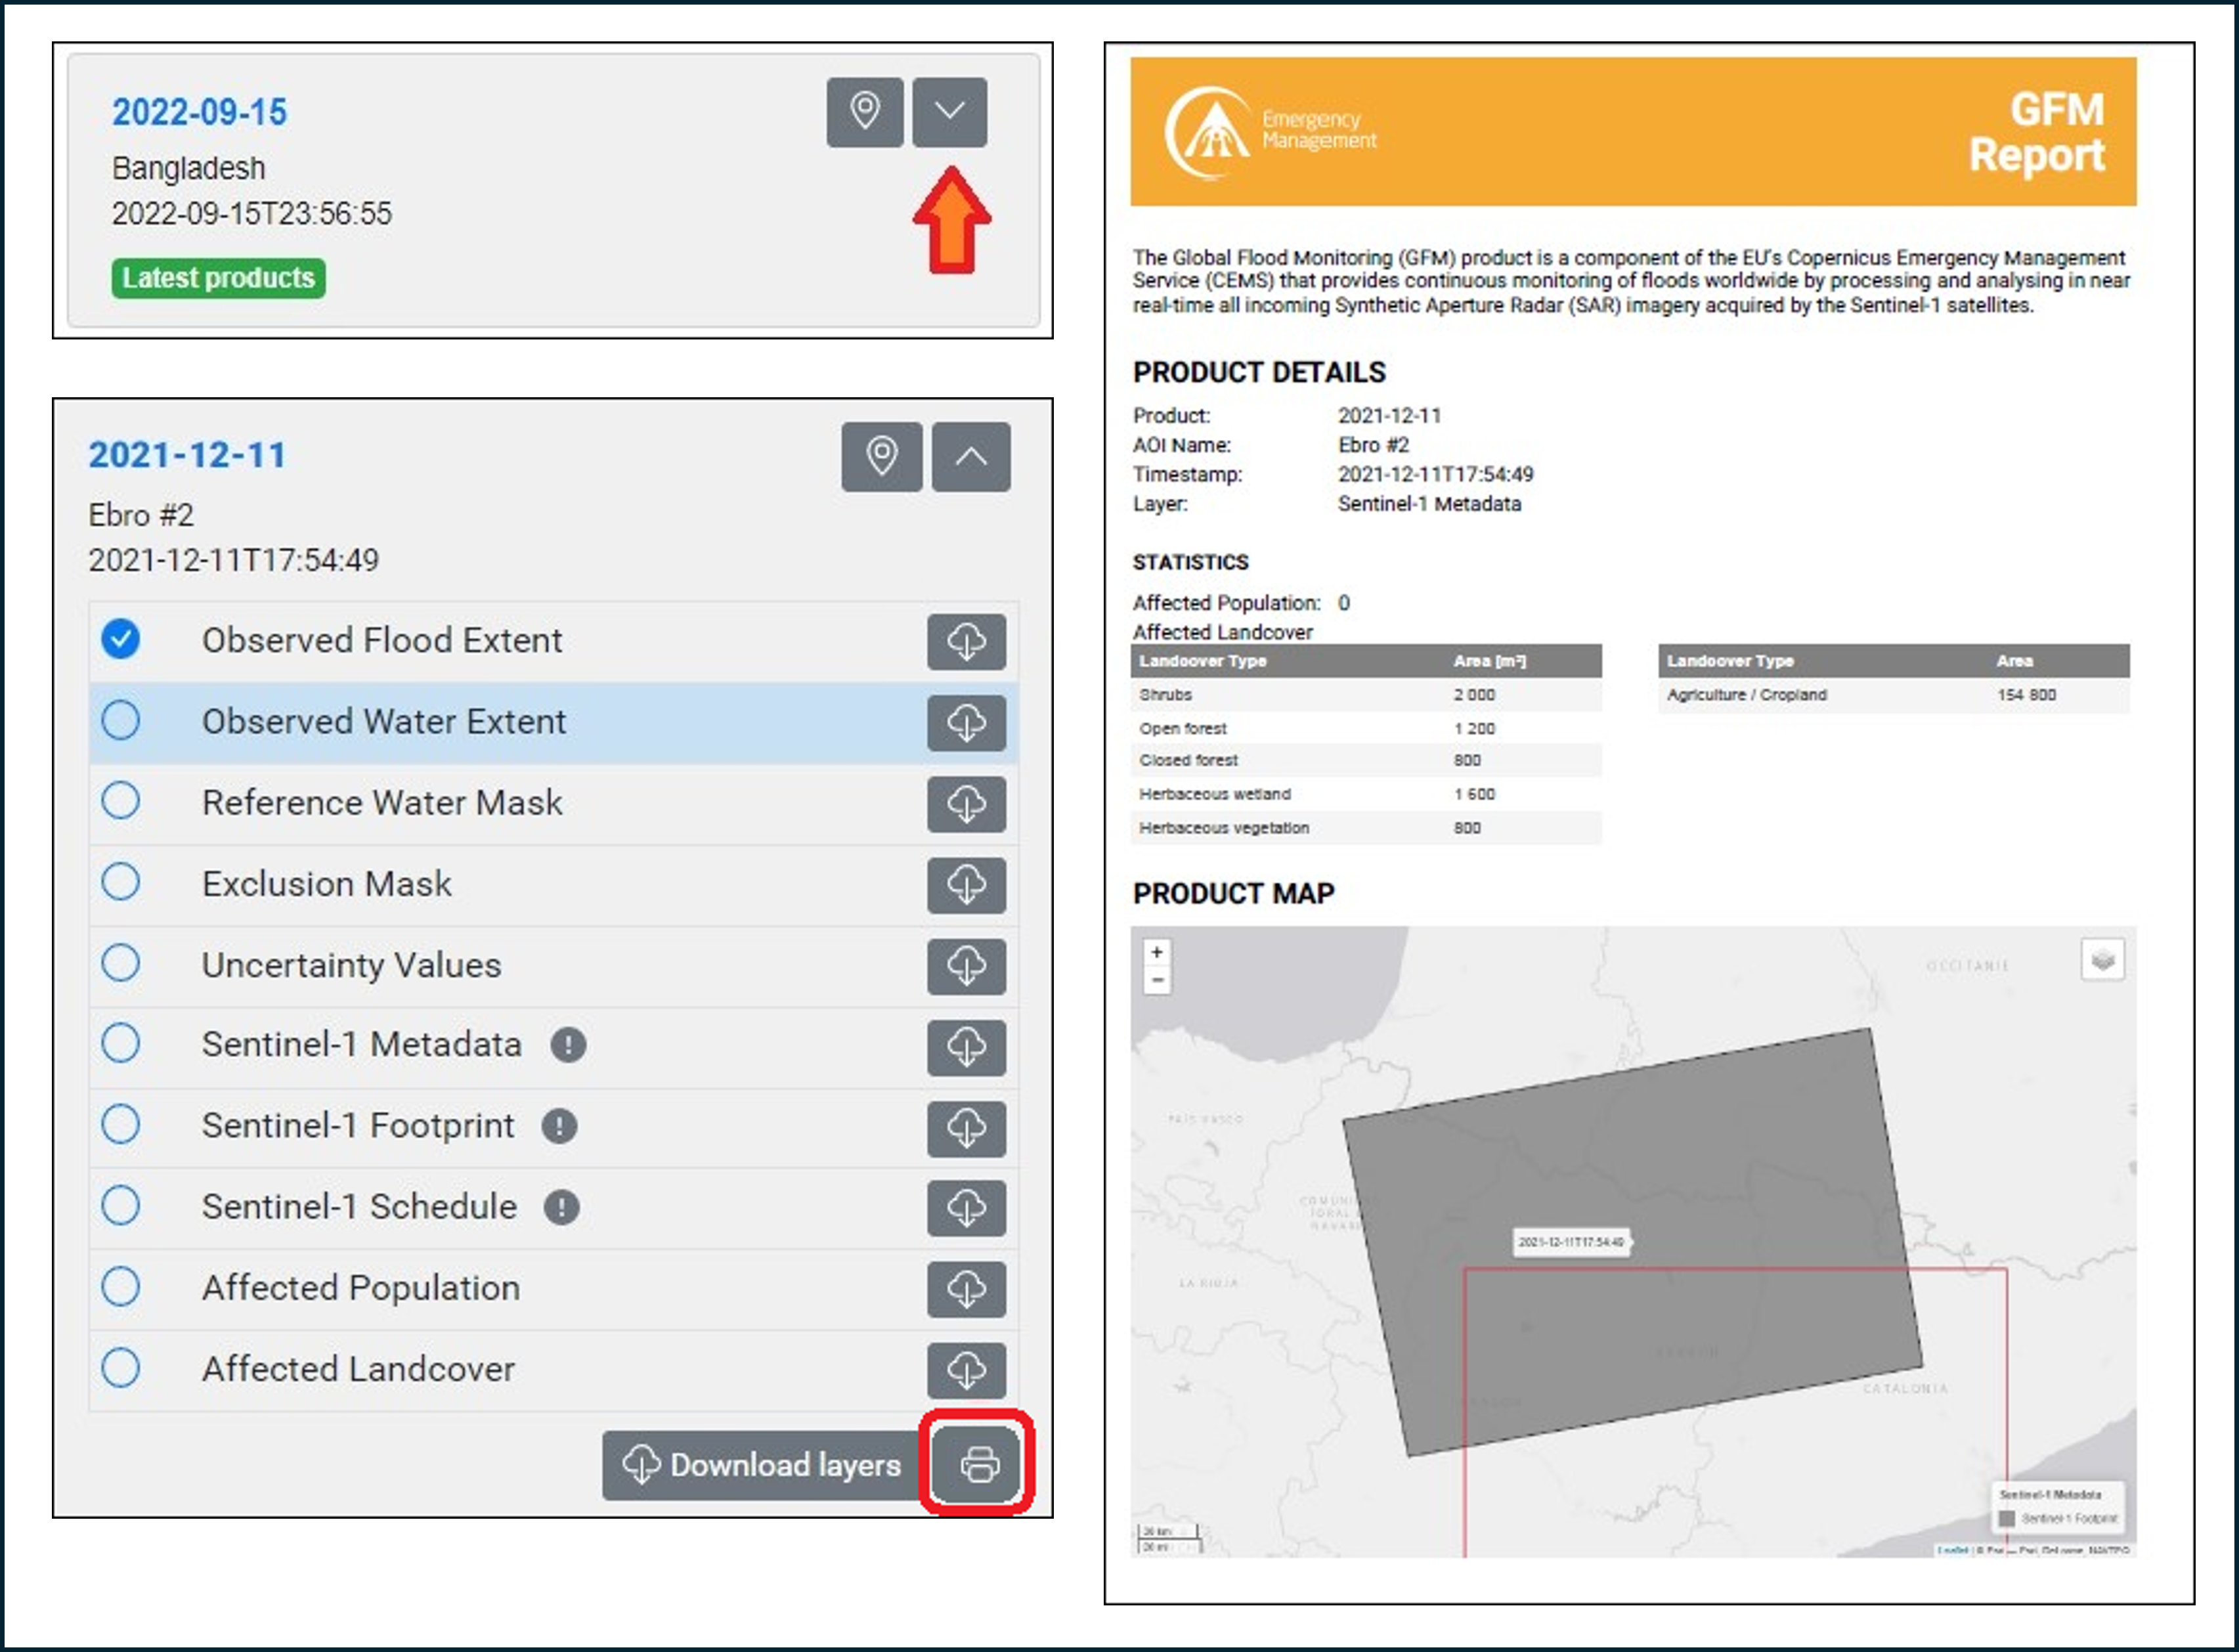
| 1. To generate a short report for a selected GFM output layer, the user opens the list of GFM output layers (top left graphic below, red arrow), selects an output layer (bottom left graphic below), and clicks “printer” button (bottom left graphic below, red circle). |
| 2. A PDF document is automatically downloaded to the local drive with all the basic information on the output layer (right graphic below). |
¶ 6.5.4 Activation of notifications for AOIs, via GFM web portal or X (ex-Twitter)
| 1. Click on the AOI / AOIs for which notifications are required. |
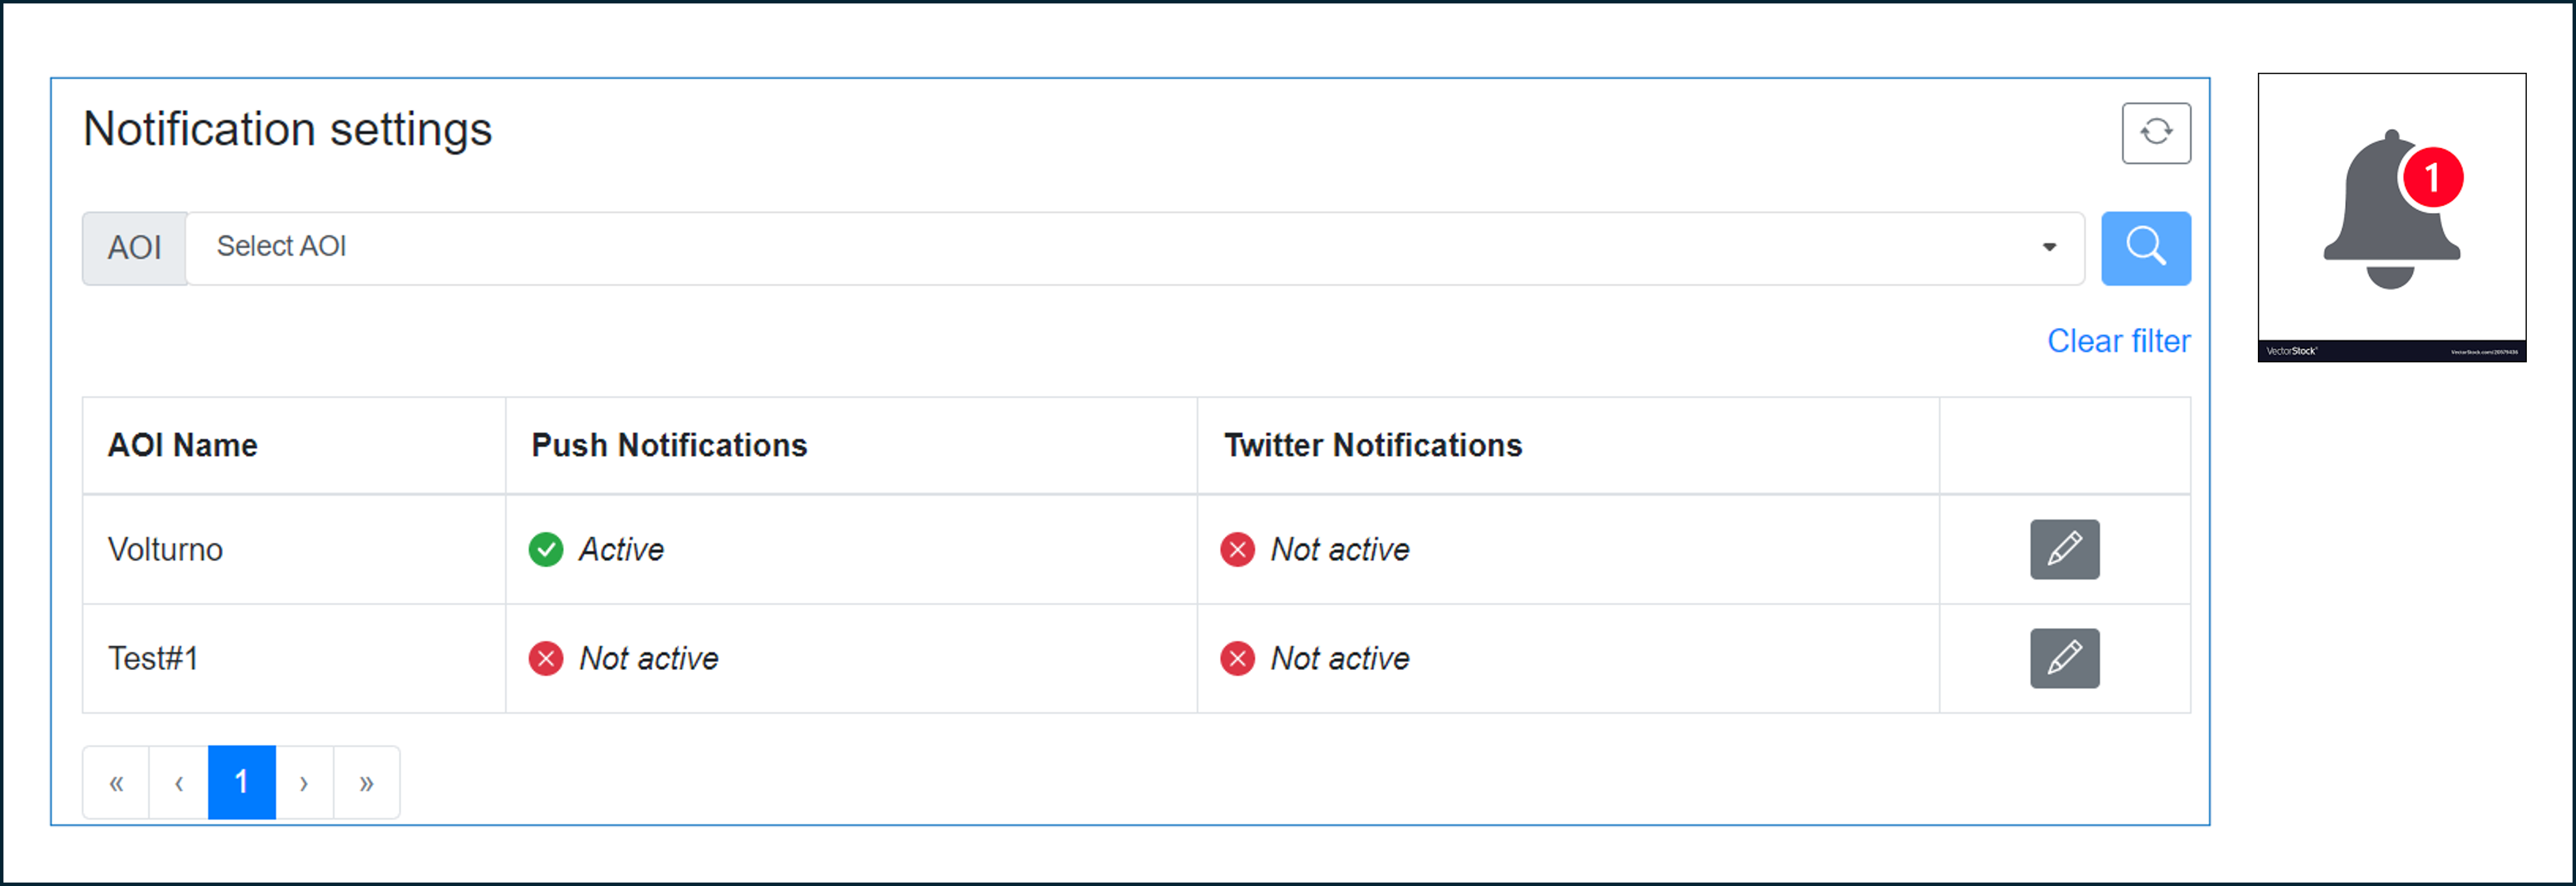
| 2. The system opens a dialogue window where users can choose to be notified by email or through their X (formerly, Twitter) account (left graphic below). |
| 3. Every time users will access the application, the bell-shaped icon in the top right corner will show the number of new / unread notifications (right graphic below). |
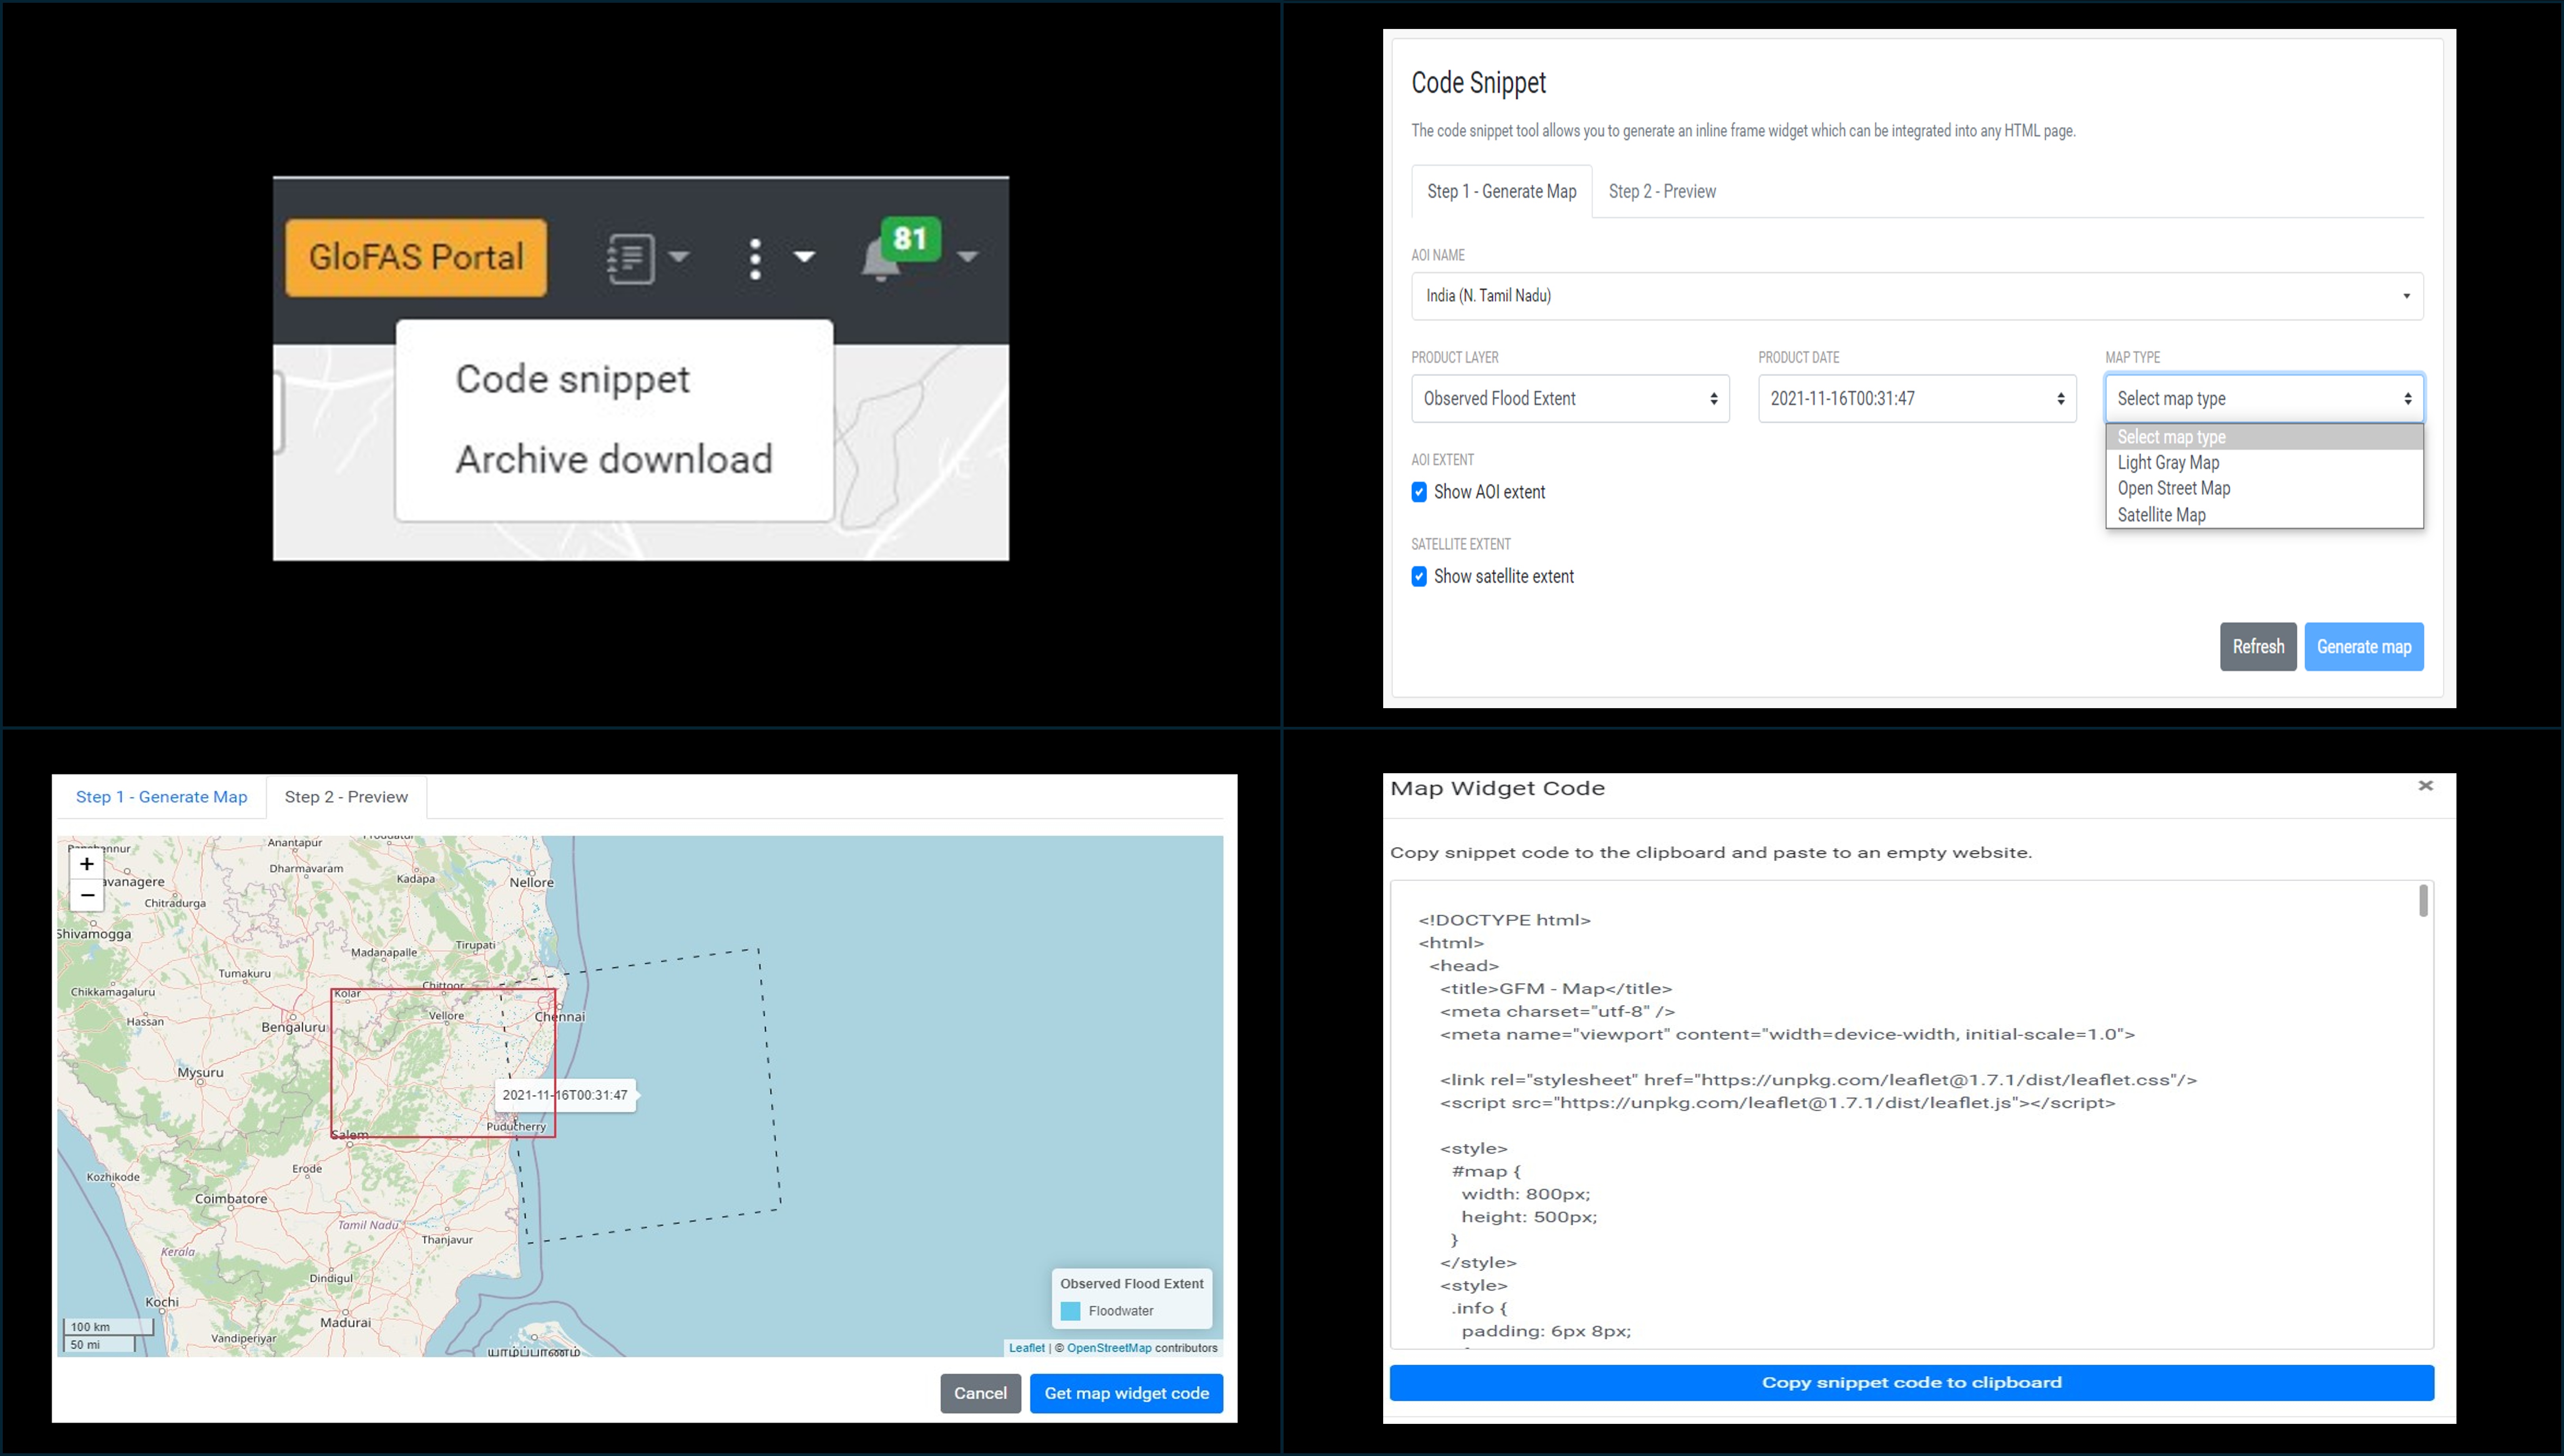
¶ 6.5.5 Code snippet tool to create inline frame widget for integration in a HTML page
|
| 2. Once done, the system will open a form users shall fill in to request the desired product layer, acquisition time, and background for a specific AOI (top right graphic below). |
| 3. After all the needed parameters are entered, users must click on the "Generate map" button: the system will then display a preview of the map according to user's request (bottom left graphic below). |
| 4. If the generated map fulfils the requirements, users can ingest it as a widget code by copying it into their HTML code (bottom right graphic below). |
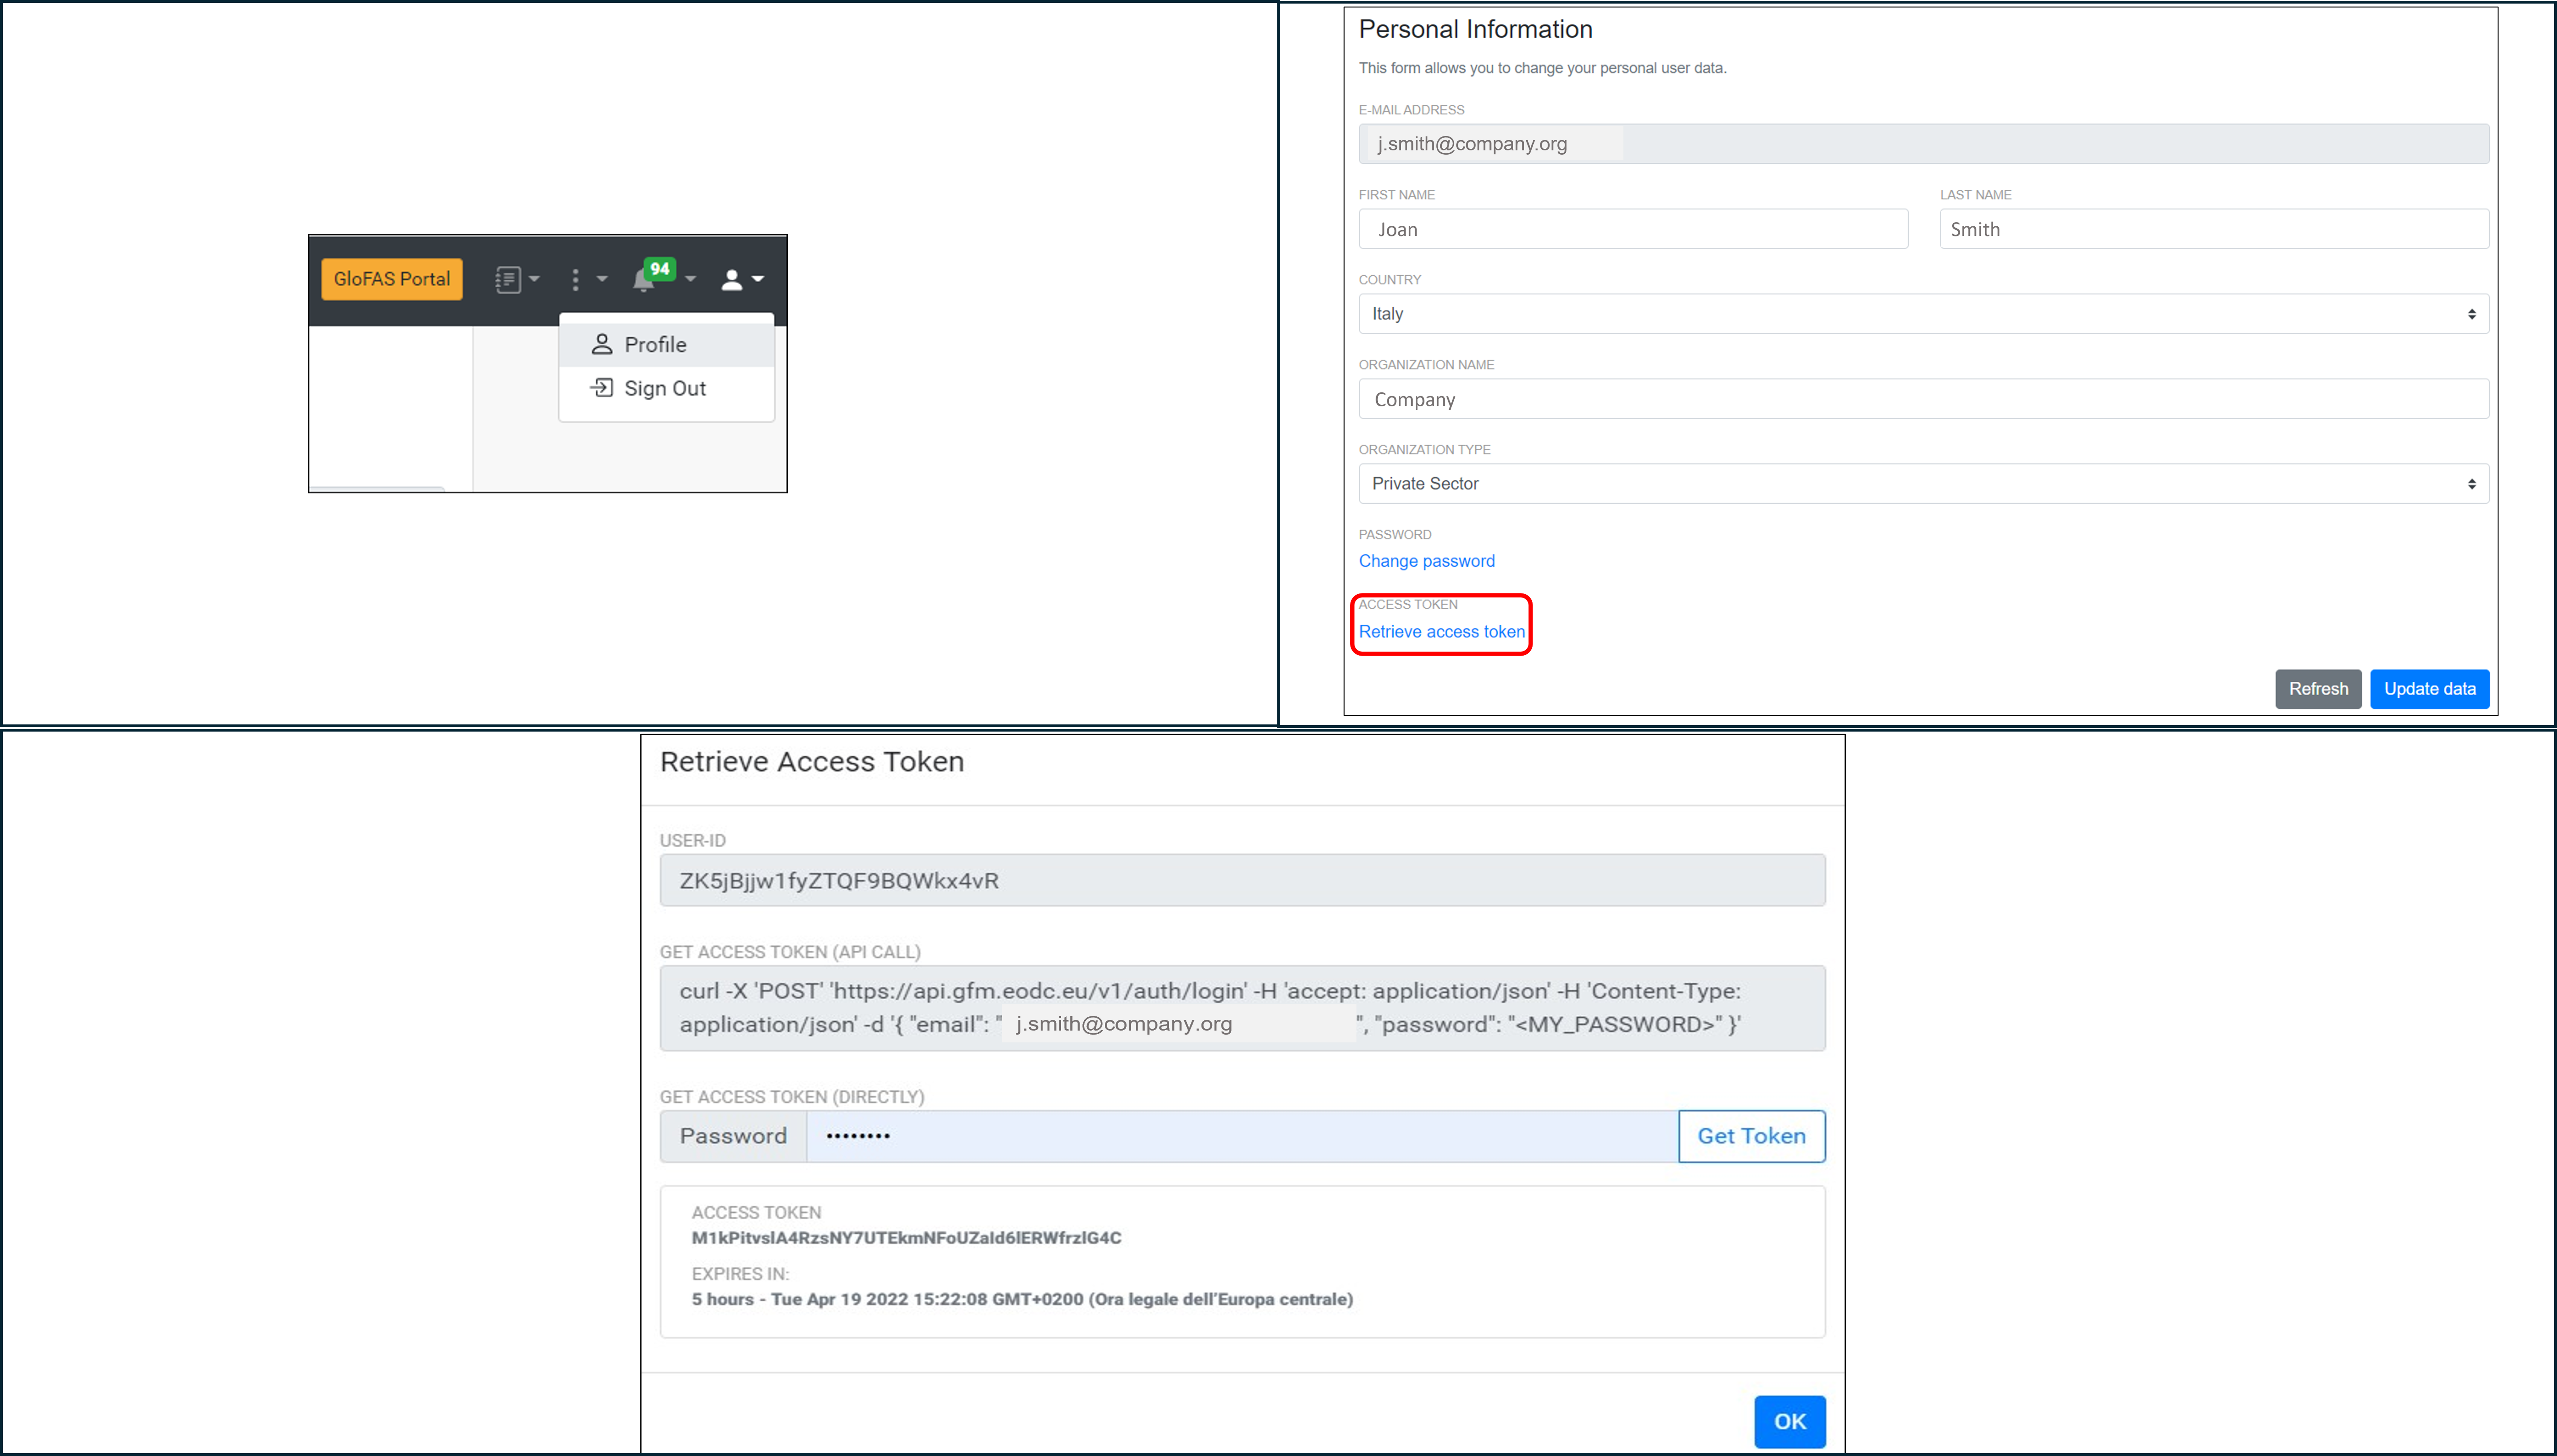
¶ 6.5.6 Retrieval of tokens to access GFM output layers through a set of REST-APIs
| 1.GFM offers the possibility to access its products through a set of REST-APIs. To use the APIs, users need to get an access token that can be retrieved in their "Profile" section of the GFM Web Portal (top left graphic below). |
| 2. The token could be then retrieved by clicking on the button "Retrieve access token" (top right graphic below). |
| 3. The final step is to type the personal password in the text box at the bottom of the pop-up and to press the “Get Token” button (bottom graphic below). |
| 4. The system will then generate a temporary token that will be valid for the next 5 hours. |
Didn't find what you were looking for? Send us a message through the contact forms:
EFAS: https://european-flood.emergency.copernicus.eu/en/form/feedback [Flood Monitoring]
GloFAS: https://global-flood.emergency.copernicus.eu/contact-us/ [Satellite-based Global Flood Monitoring]